
This map hangs in the Clatsop County Manager’s Office and is prominently displayed in various locations throughout Clatsop County public buildings.
This map was made using ArcGIS Pro 2.8.2 and all data is maintained by myself as the Clatsop County GIS Technician. This is an excellent example of my strength in striking the balance of using both my technical GIS skillset with my ability to collaborate with high-level decision makers to ensure map products are technically functional for managers and cartographically appealing for the public.

At the instruction of the Clatsop County Manager, I assisted the Polco National Research Center in defining Clatsop County’s rural community boundaries. This project folds into a larger vision of how the county government supports rural communities with federal funding.
My geographic knowledge of the local area allowed me to be the “expert” voice in the room as to how the rural communities of Clatsop County can be represented accurately and equally in matters of political polling.
By speaking up during high-level meetings with project managers and organization leaders, I was able to steer the project in a direction that best spatially represented these smaller communities by articulating and justifying my position with geospatial reasoning.
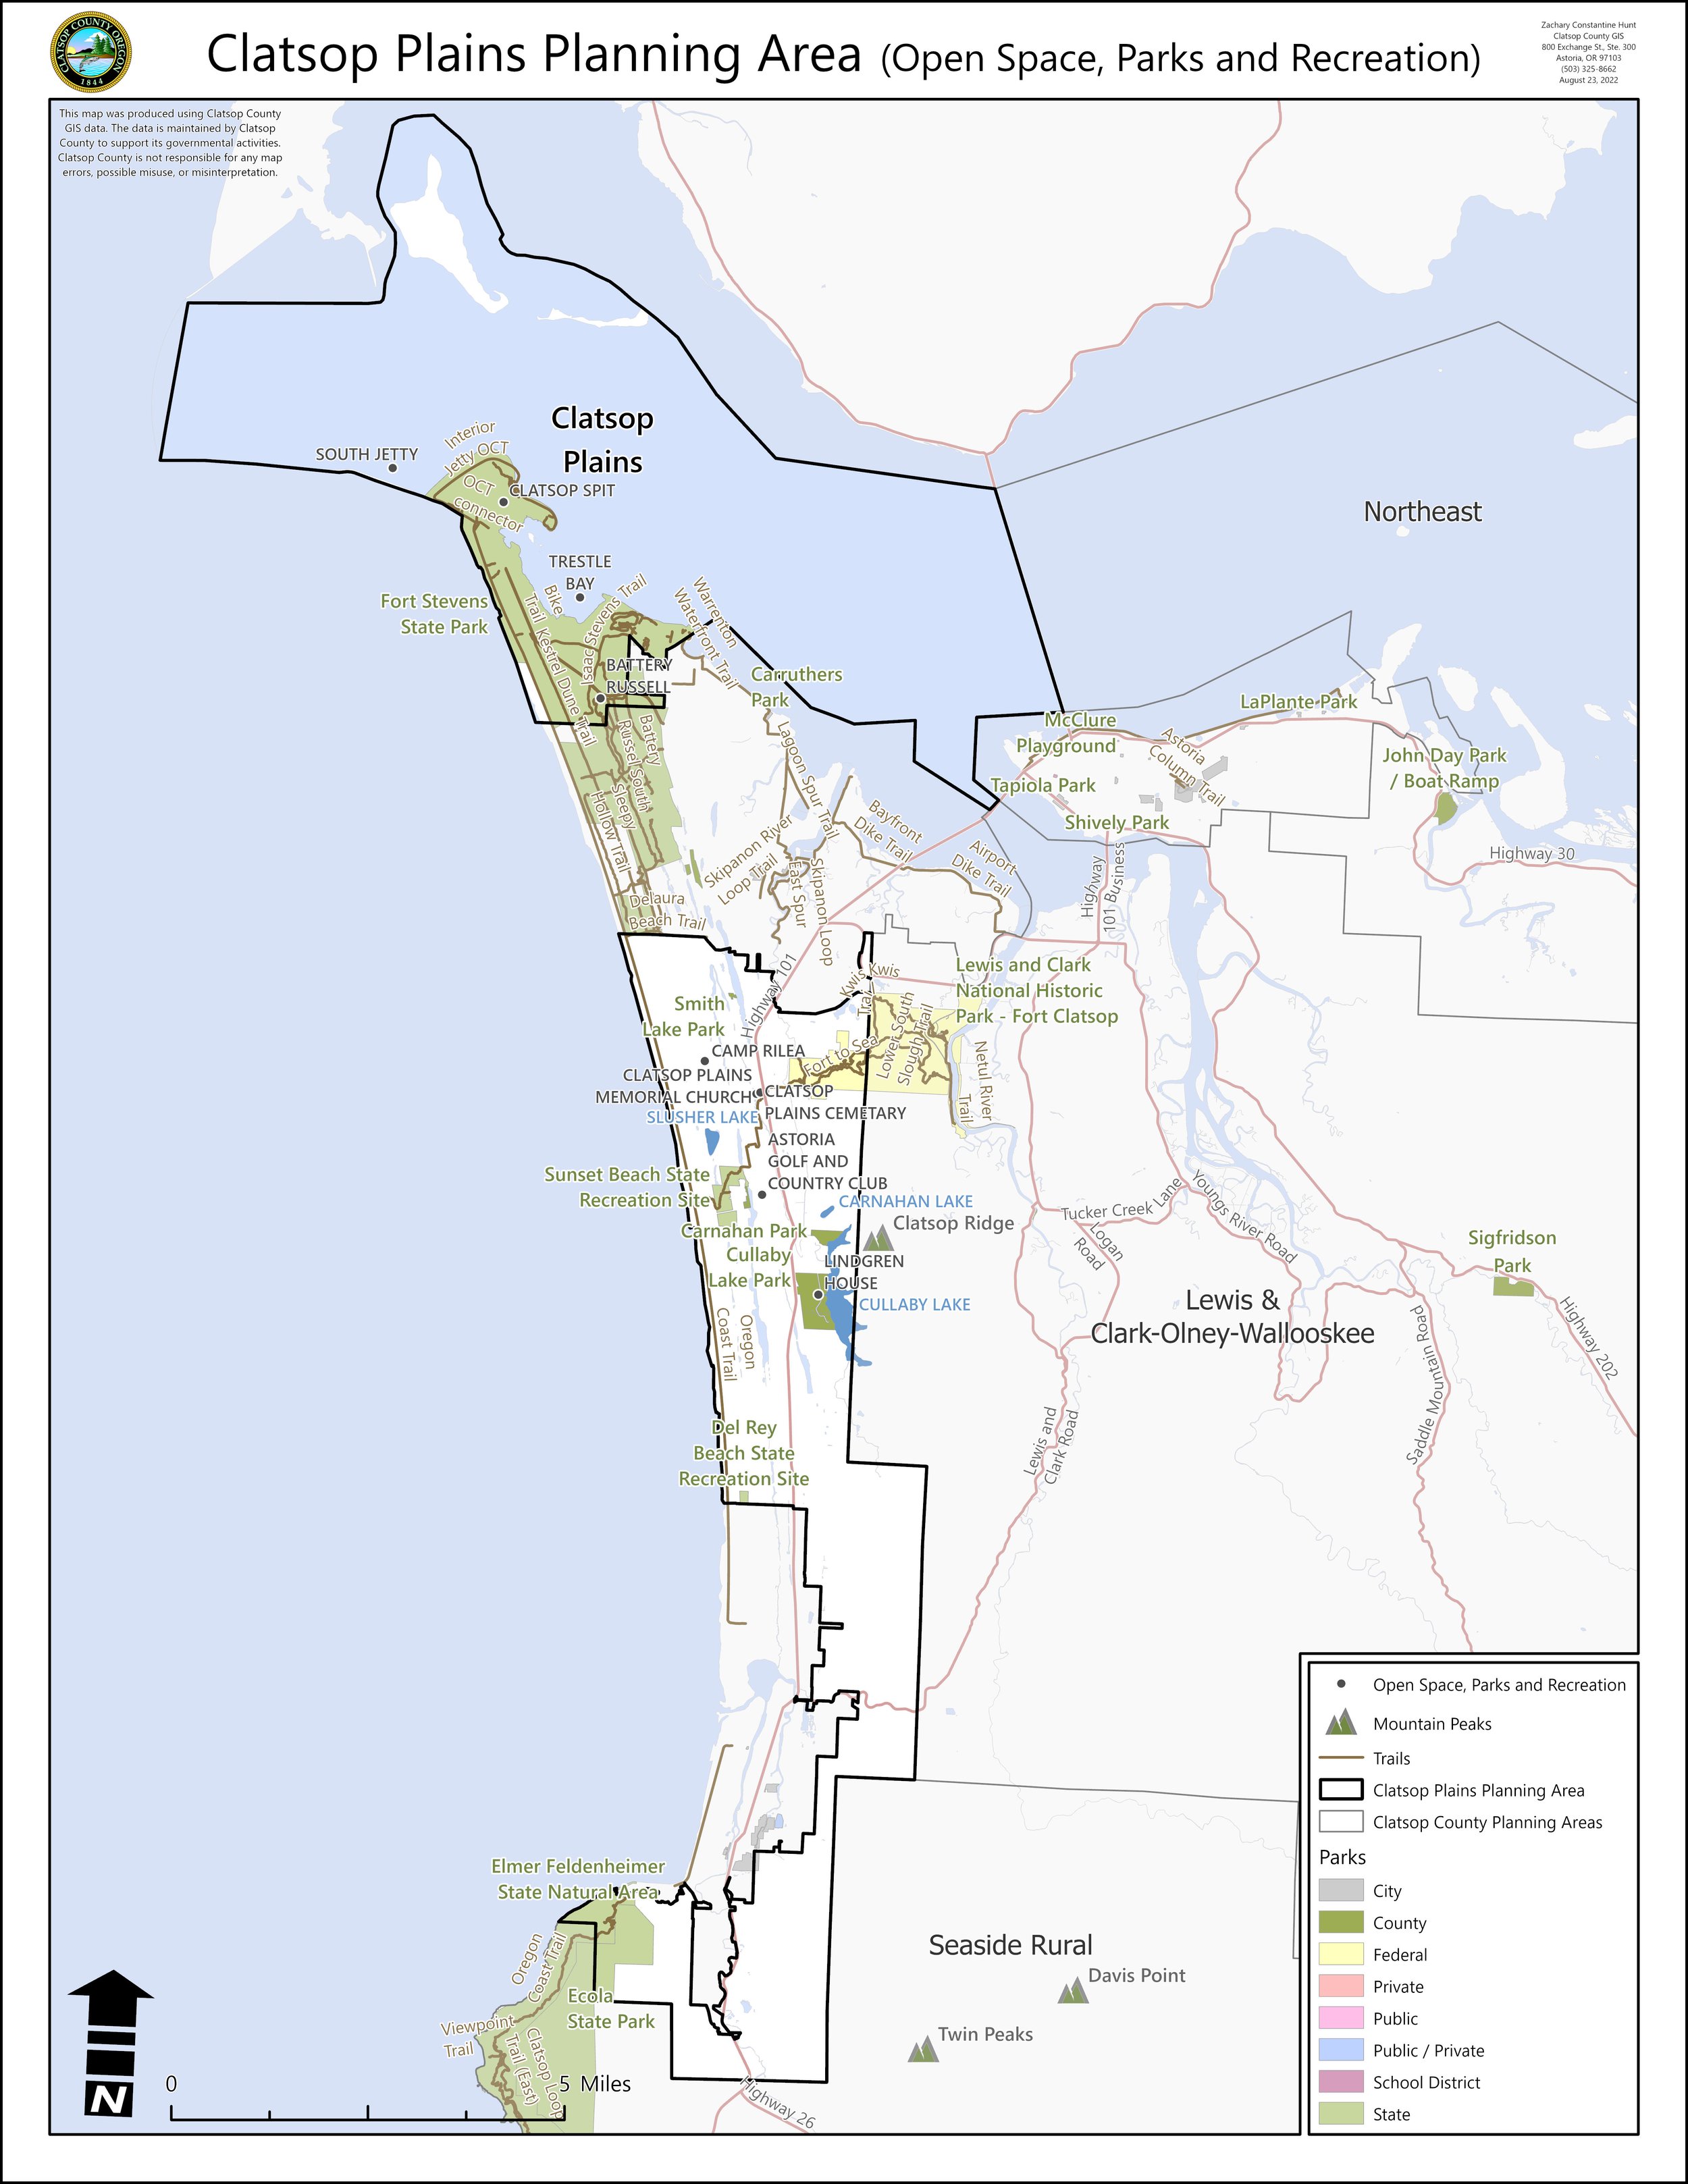
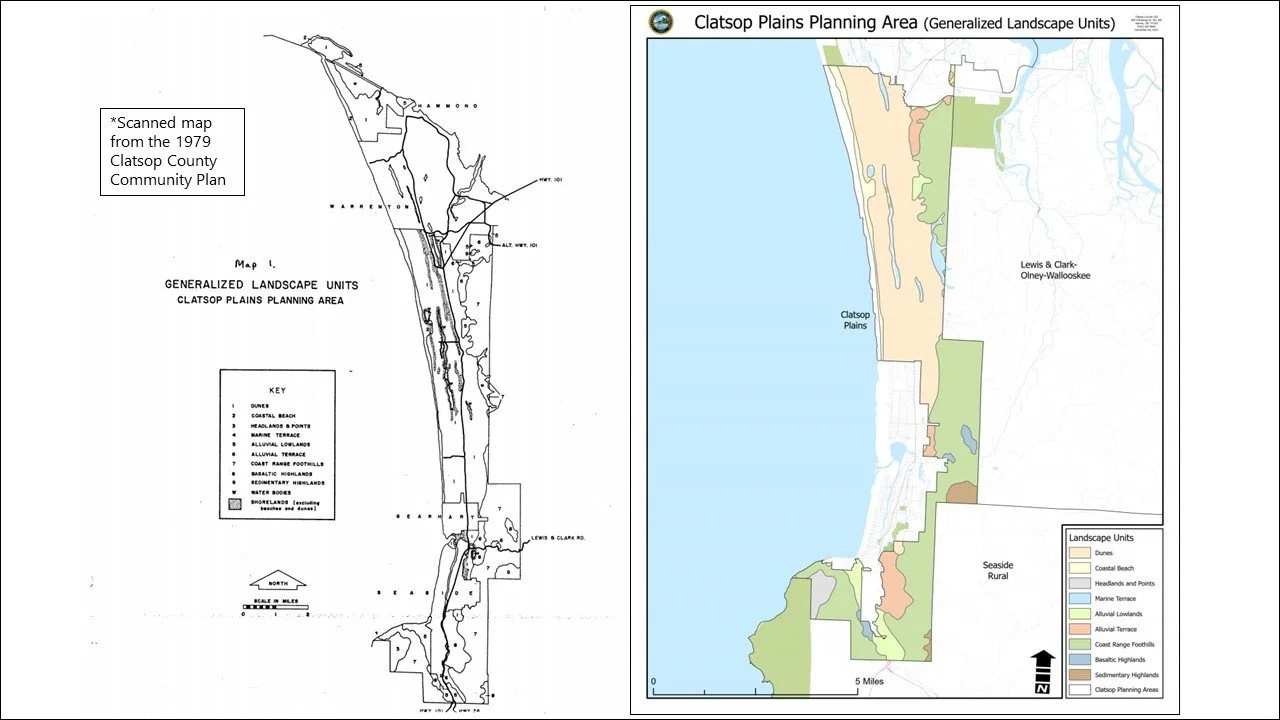
This product is one of more than 60 maps and graphics that I created for Clatsop County’s 40-year Community Land Use Plan. These community plans are developed by county staff in coordination with local community members and private stakeholders to guide community development within the rural communities of Clatsop County.
Being from rural Oregon myself, I took full ownership of this project and found a great deal of pride in helping rural stakeholders come to informed decisions on the future of their local community through spatial understanding.
Many of these maps were derived from the original 1979 community plan maps. Some maps such as this one, however, were made with a combination of georeferenced data, digitized raster data, digitized legal descriptions, internal county data and external GIS data in various formats.
A local school district reached out the the Clatsop County GIS department about producing contour graphics for a clothing line for students and parents.
I produced six 1:24,000 contour graphics for the Jewell School District, collaborating with the district’s Superintendent.
Graphics were created from DEM models in ArcGIS Pro 2.8.2, converted to PDFs and JPEGs and then used by a local print shop to make t-shirts, hats, etc. which are worn by community members during school events.
This was an excellent chance to use my local knowledge and communication skills to provide useful context for project stakeholders, while relying on my technical expertise to ensure a quality, accurate GIS product.
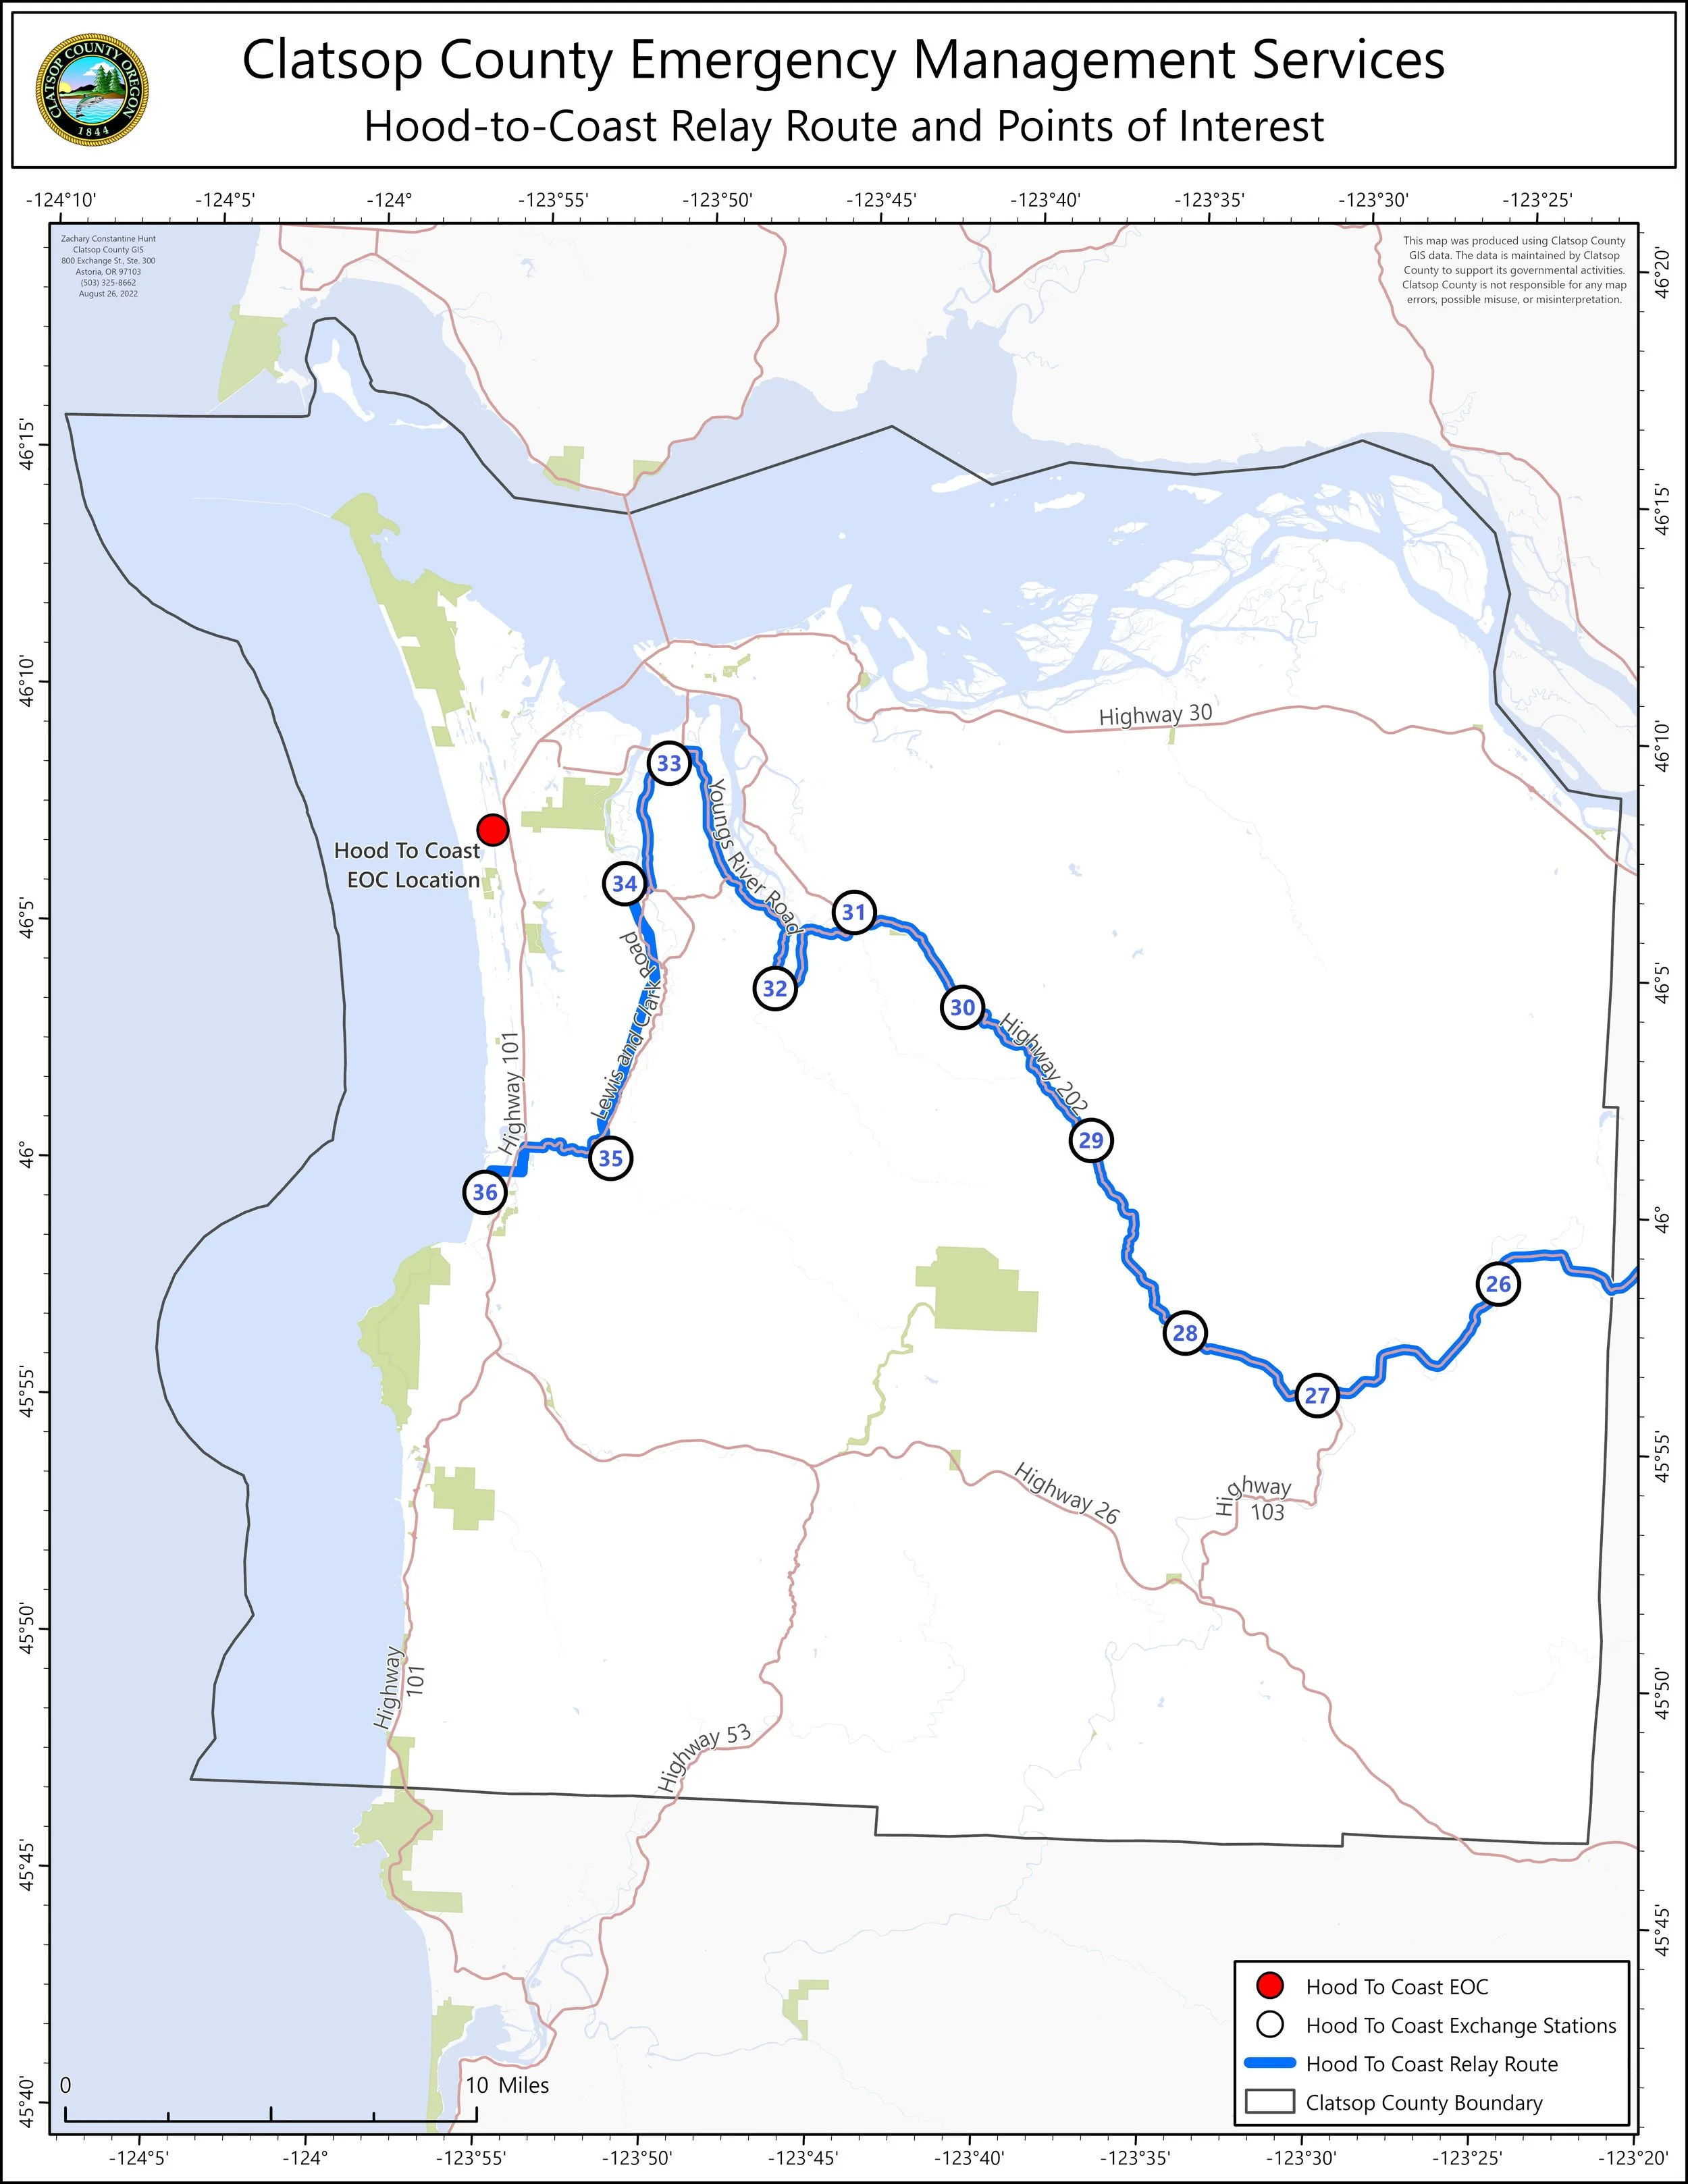
This map was distributed to dozens of emergency managers and volunteers overseeing the 2022 Hood To Coast Relay Race.
Due to an unforeseen planning error, I was asked to produce this map in less than 4 hours the day before the race. This was a fantastic test of my resourcefulness, delegation skills and solutions-based mindset.
Our GIS shop did not have the waypoint or race route data, so I tapped our GIS Analyst to begin georeferencing the waypoints while I georeferenced and digitized the race route. I keep project templates staged for quick turnaround projects, so I was able to rely on my planning efforts to accomplish the tight turnaround. Our team published the map in just a few hours and it was distributed to emergency managers and race volunteers the next morning.
This map is an example of my experience in creating public-facing maps on a quick turnaround while adhering to the cartographic principles of map-making.
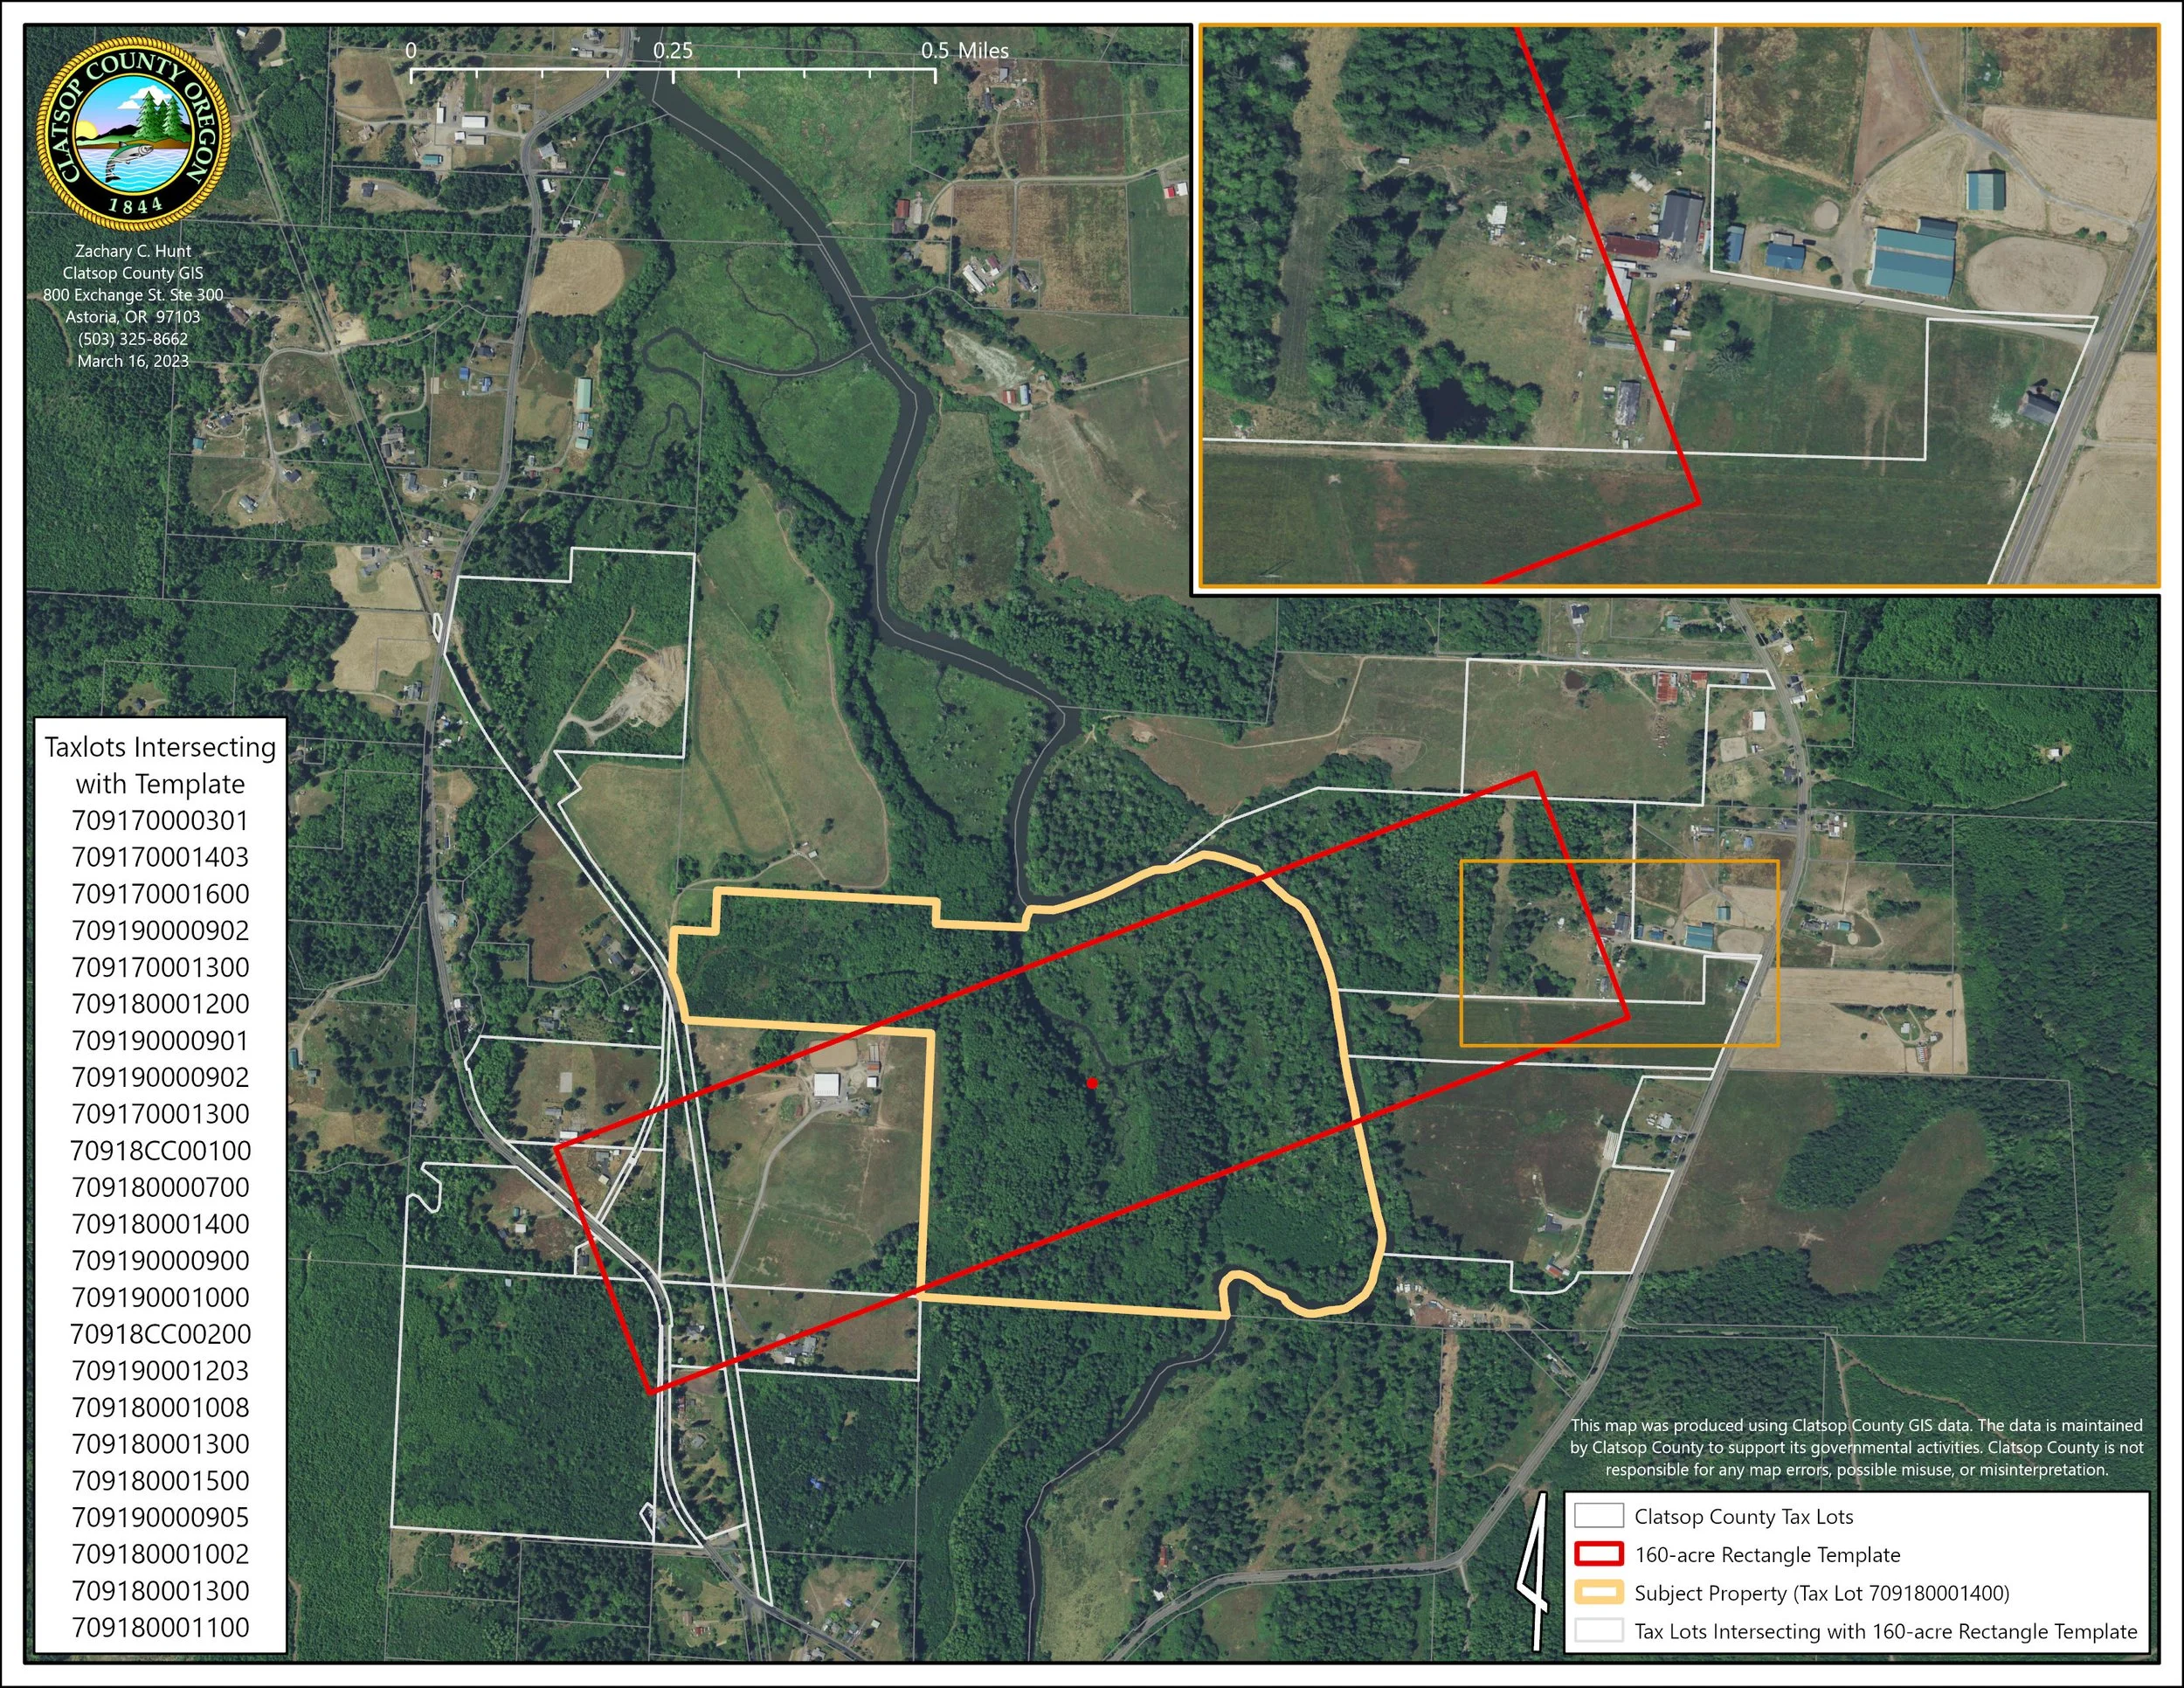
This map was used by the Clatsop County Planning Department in a land use report that is distributed to high-level decision makers before making a decision on development in the area. These requests are common and typically require a tight turnaround of a few days.
Map was made in ArcGIS Pro 2.9.5 using data that is maintained by myself as the organization’s GIS Technician.
This deliverable is a part of a running series of maps produced for the Clatsop County Planning and Public Works Directors. Both offices recently discovered dozens of historic planning maps that needed to be recreated.
I performed the following workflow to produce several maps to be used in high-level meeting with County Managers and Commissioners: Formatted the scanned PDFs into JPGs, created a project directory and APRX, georeferenced the rasters in ArcPro 2.8, digitized the raster boundaries as SDE polygon feature classes, added contextual layers to the project, followed standard cartographic principles and exported the final deliverables as both PDFs and JPGs.
The screenshot here shows the original scan on the left, and the final deliverable approved by the county on the right.

This is a map that was requested by the Clatsop County Community Development Director and was used in an October 13th, 2021 Board of Commissioners meeting to discuss the upcoming redistricting process.
This is a great example of my cartographic experience working within ArcGIS Pro while managing client expectations, knowing that the final deliverable will be included in the public review of high-level governmental decision-making processes.
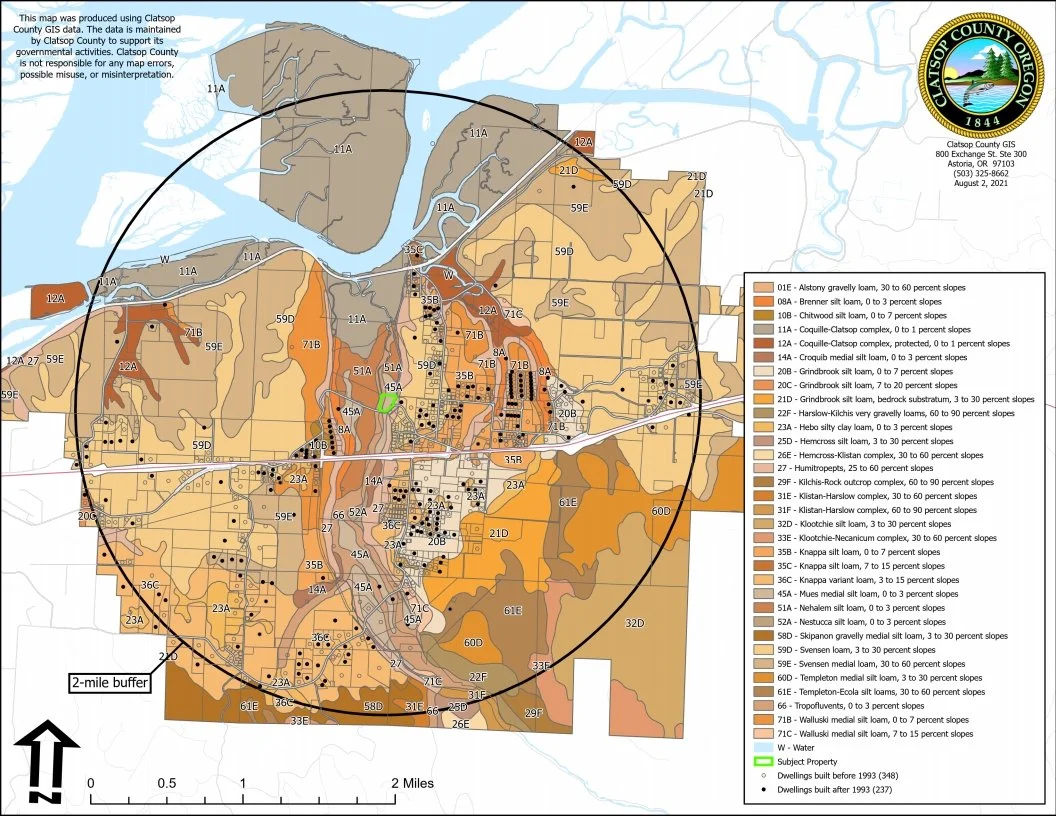
In my position as Clatsop County’s GIS Technician, I am regularly asked by county staff to perform analysis and produce deliverables on a quick turnaround. This is an example of a final deliverable that I put together for the Clatsop County Planning Department in less than a day. They needed to know the dwelling count and designation within a 2-mile buffer zone, as well as the soils composition of the buffered area. Analysis was performed in Python 3.7 and ArcGIS Pro 2.8 and the map was post-processed in a PDF editor. This map product was used in a final report pertaining to a zoning permit application.
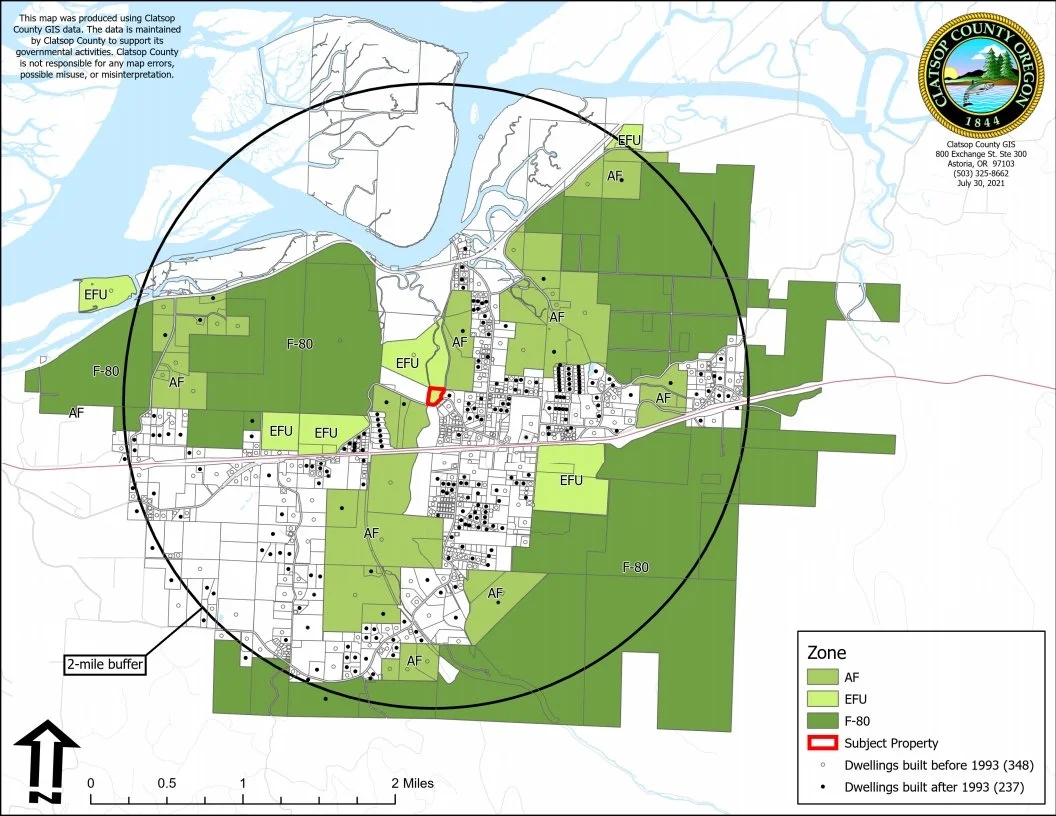
In my position as Clatsop County’s GIS Technician, I am regularly asked by county staff to perform analysis and produce deliverables on a quick turnaround. This is an example of a final deliverable that I put together for the Clatsop County Planning Department in less than a day. They needed to know the dwelling count and designation within a 2-mile buffer zone, as well as the soils composition of the buffered area. Analysis was performed in Python 3.7 and ArcGIS Pro 2.8 and the map was post-processed in a PDF editor. This map product was used in a final report pertaining to a zoning permit application.
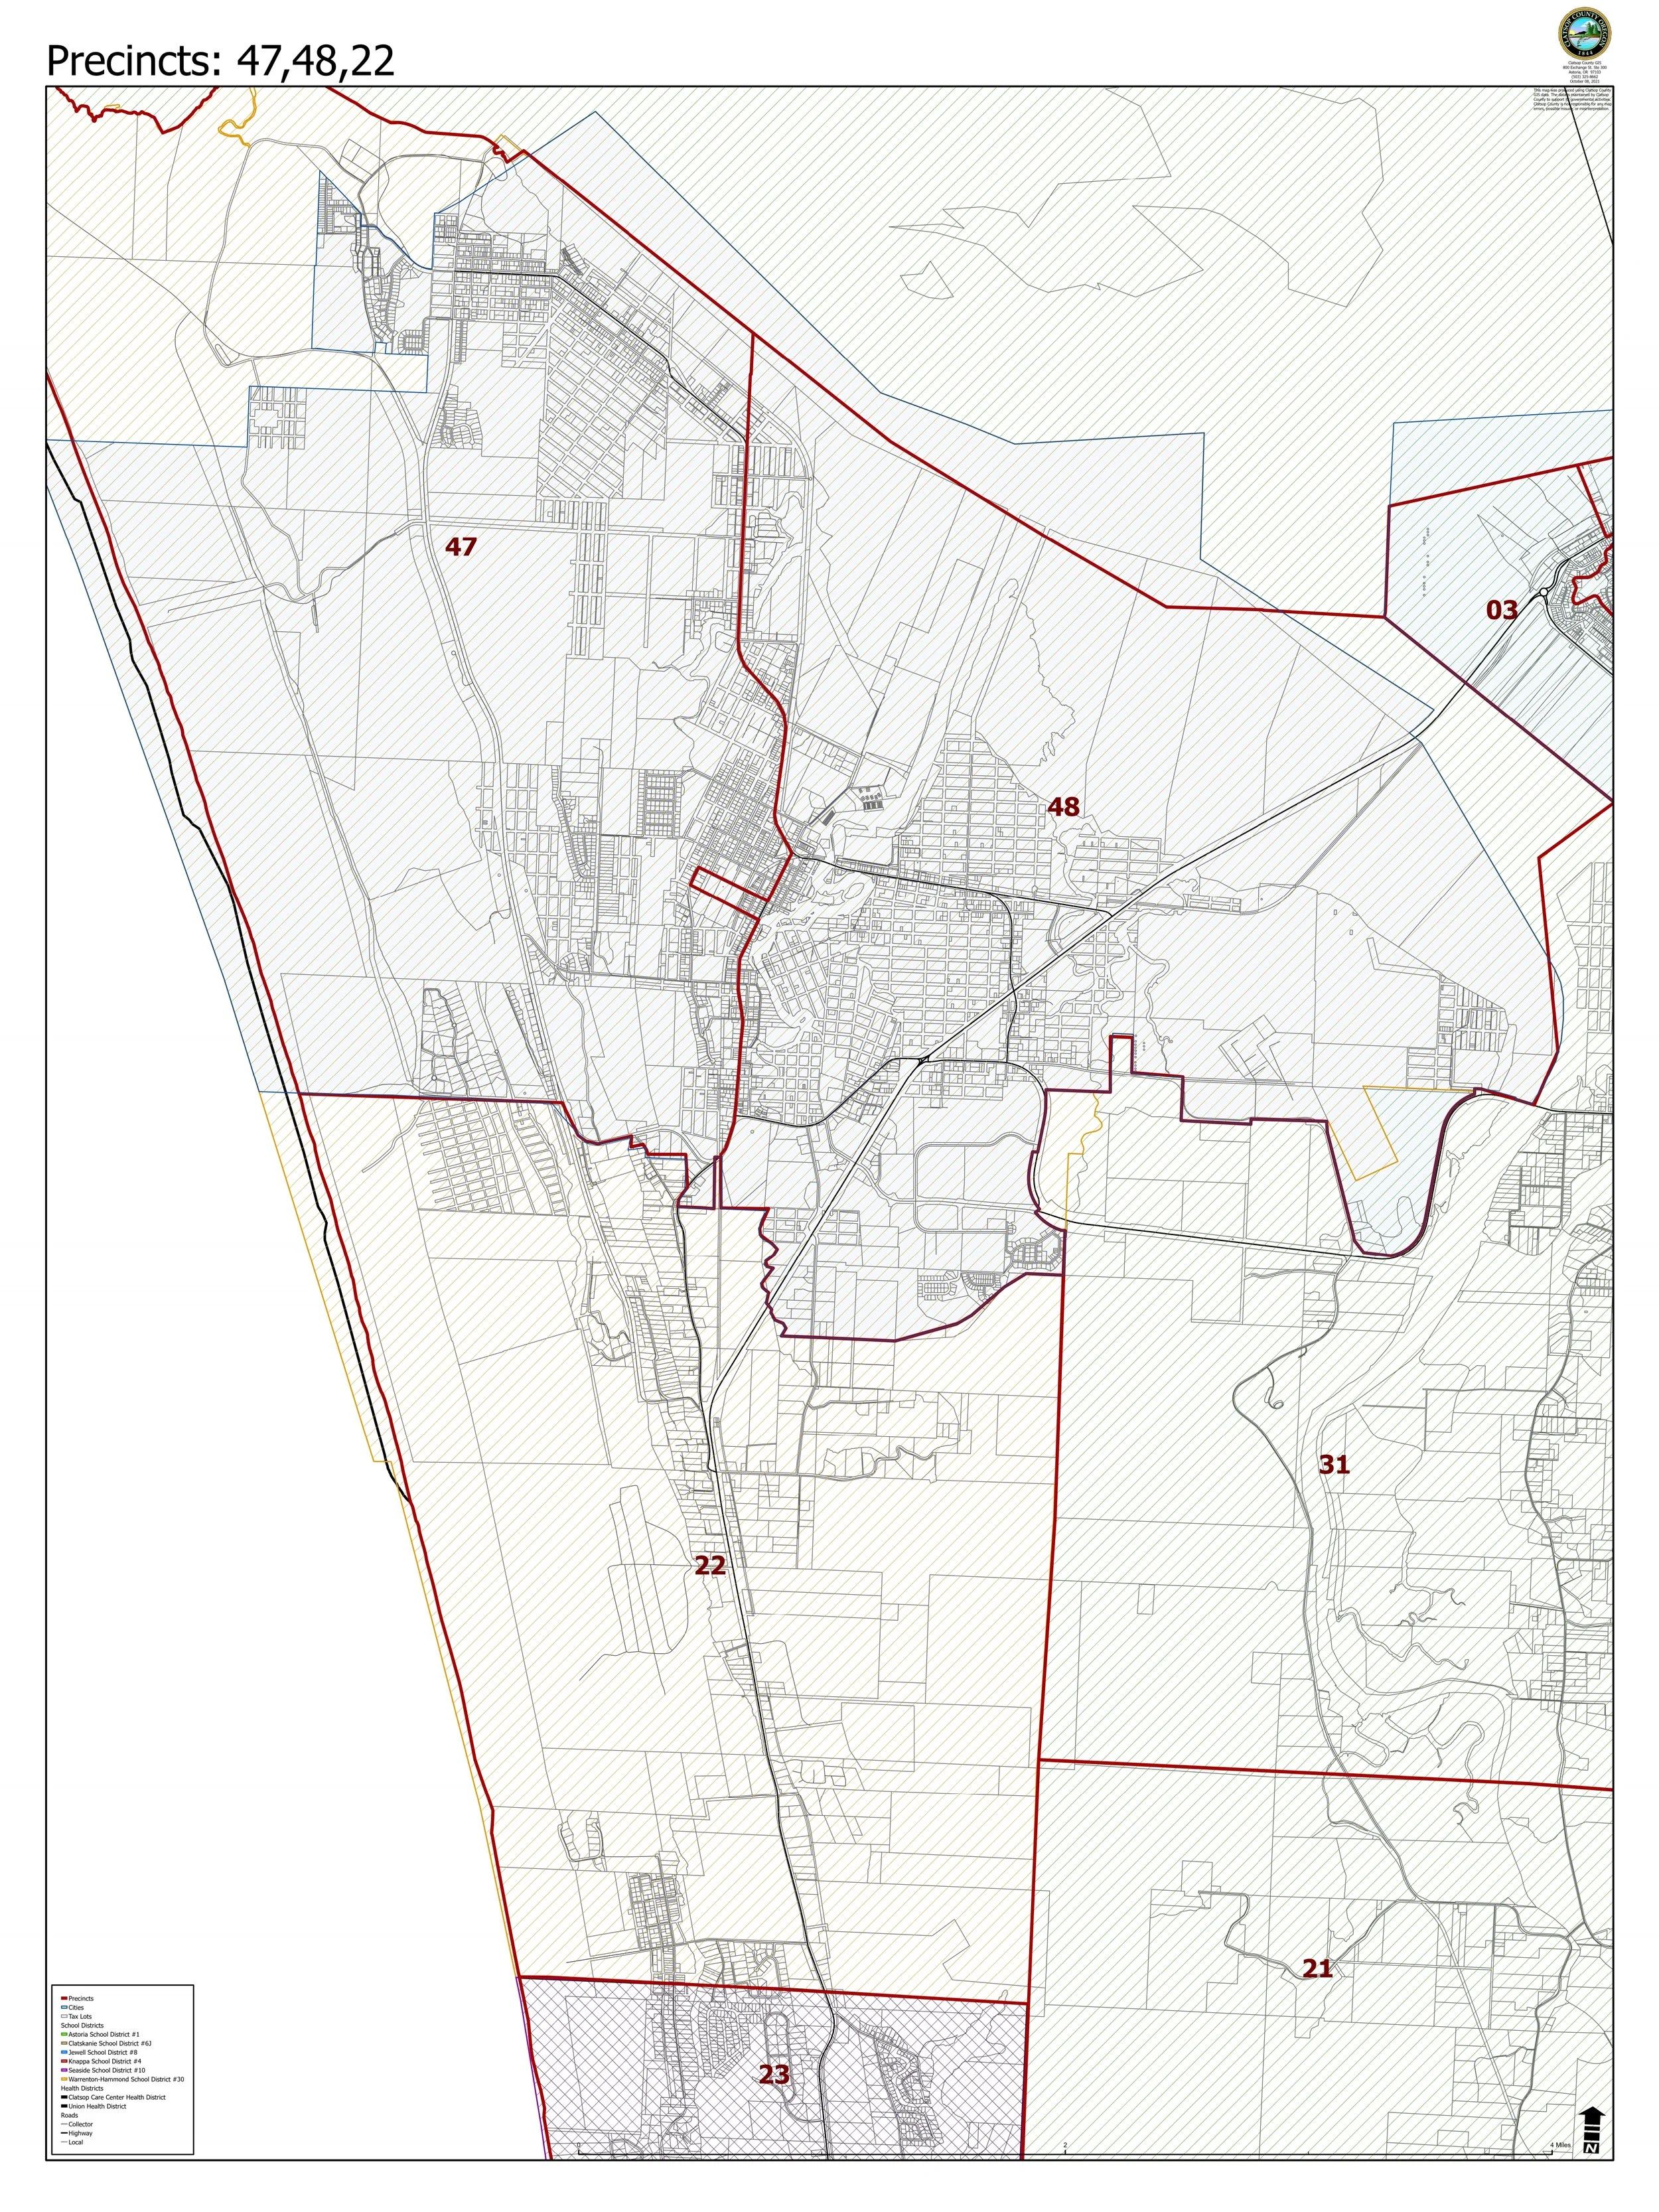
This map was made for the Clatsop County Clerk to assist their office with the monumental task of redistricting the voting precincts. I was asked to make a series of maps “as large as possible” so the County Clerk could hand draw their redistricting possibilities.
This was a fantastic opportunity to lead the GIS side of a high-stakes project with real-world impact. This allowed me to design, build and deploy this project to best suit the geospatial nature of redrawing polygon boundaries.
I created a Map Series for this project in ArcGIS Pro 2.9.0, which allowed me to print 36”x48”(Arch E) maps for the County Clerk. This was an excellent project that allowed me to develop technical skills in ArcGIS Pro and Arcade while also developing leadership skills in communication, cartographic compromise and project management.
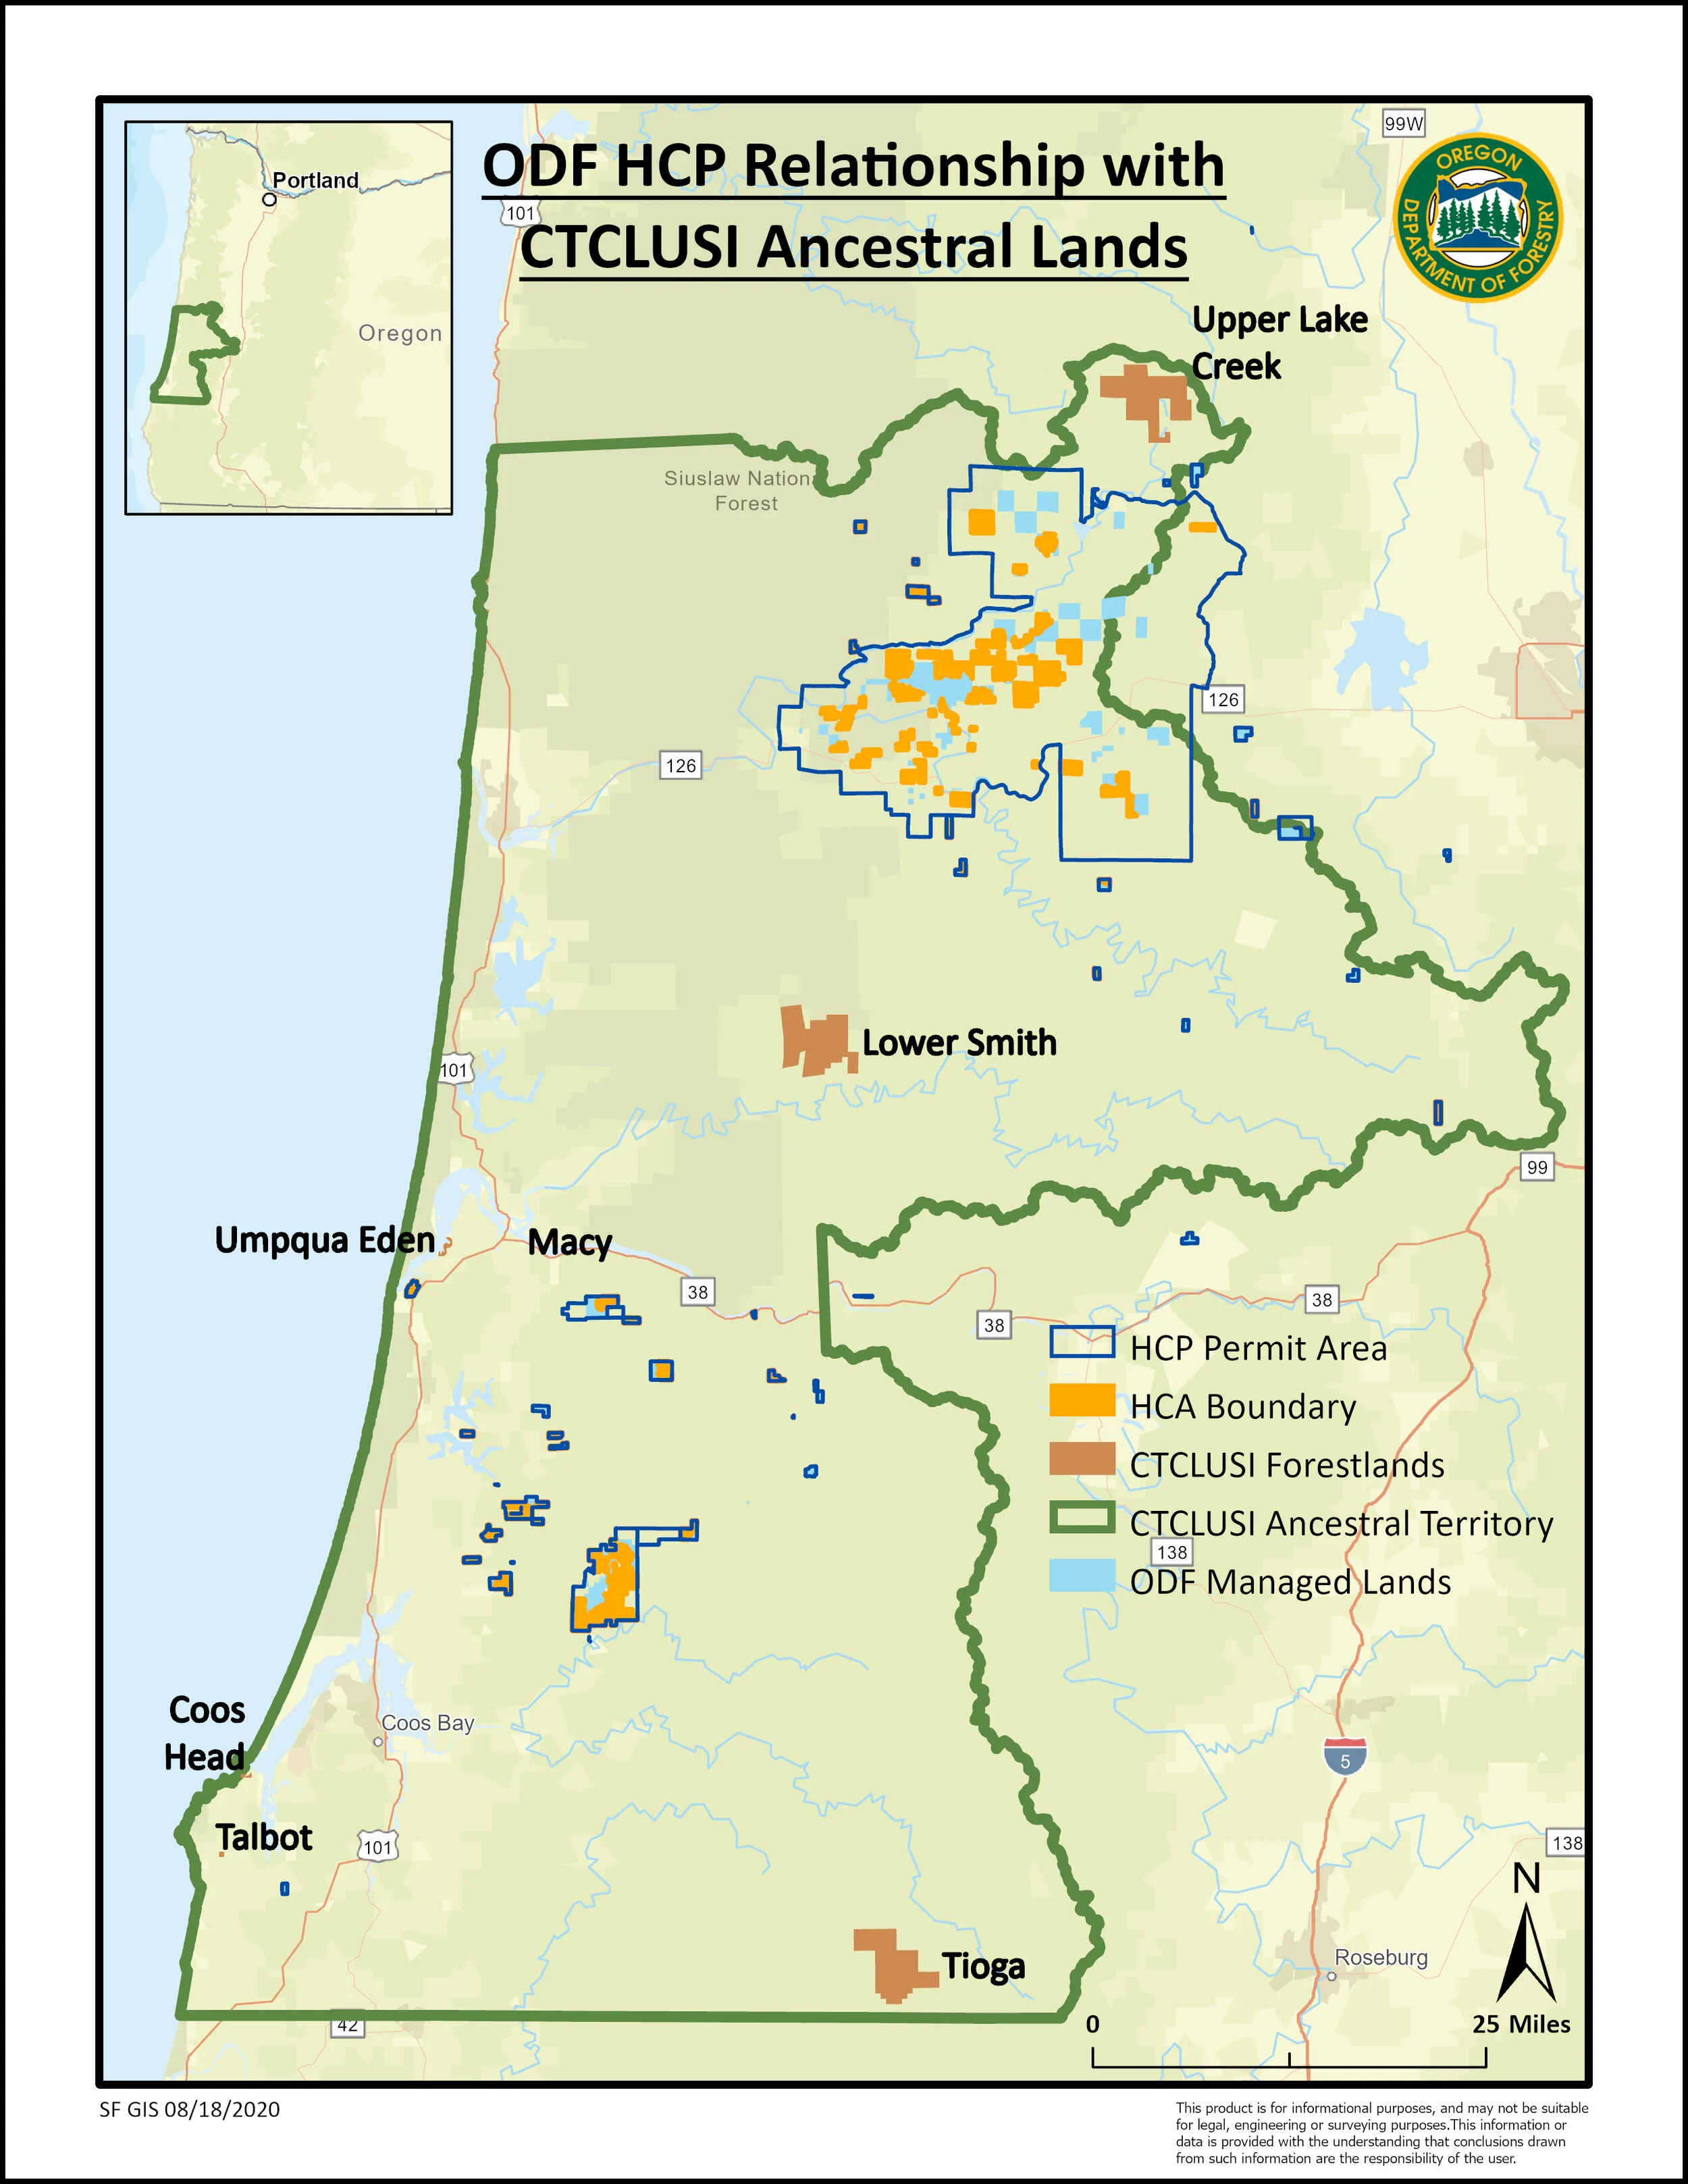
These maps were created for the State Forests division of the Oregon Department of Forestry (ODF) for the purpose of examining the relationship between ODF State Forests Habitat Conservation Areas and the Tribal Lands of the Confederated Tribes of Coos, Lower Columbia and Suislaw Indians (CTCLUSI). This was a fantastic opportunity to break away from my daily responsibilities of data management and analysis and focus on my passion for cartography and natural resources. These maps were made in ArcGIS Pro.
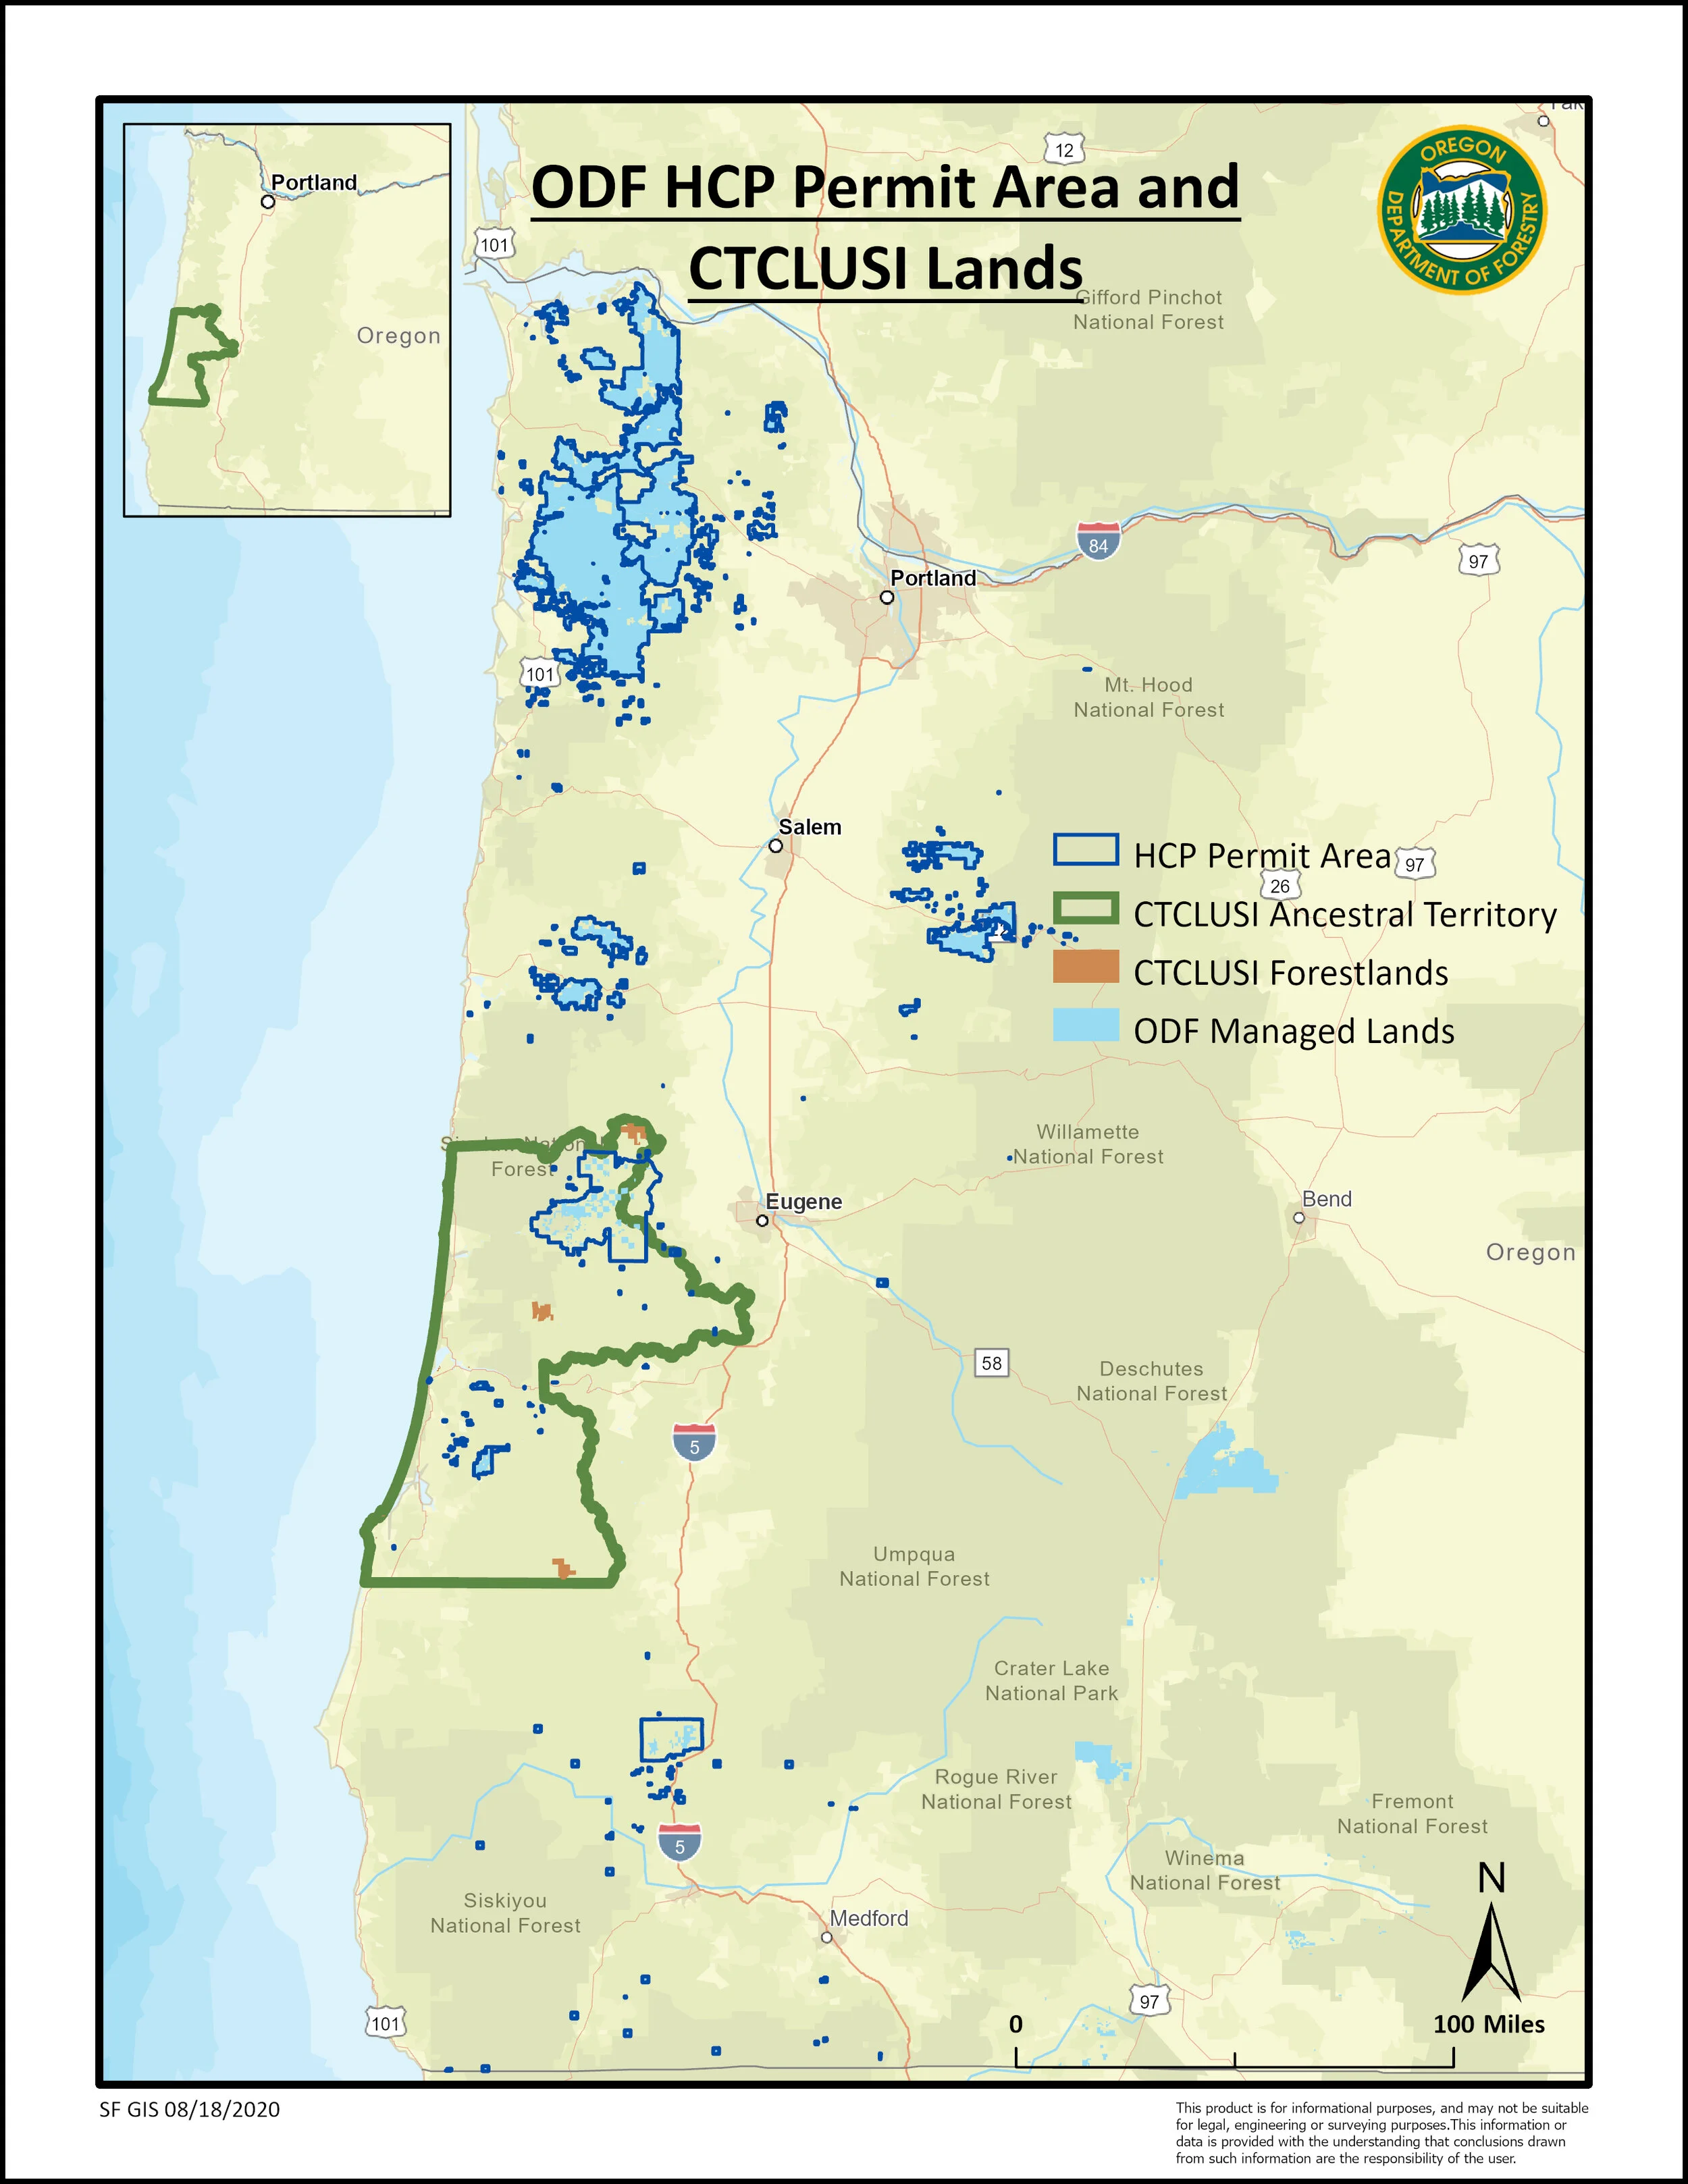
These maps were created for the State Forests division of the Oregon Department of Forestry (ODF) for the purpose of examining the relationship between ODF State Forests Habitat Conservation Areas and the Tribal Lands of the Confederated Tribes of Coos, Lower Columbia and Suislaw Indians (CTCLUSI). This was a fantastic opportunity to break away from my daily responsibilities of data management and analysis and focus on my passion for cartography and natural resources. These maps were made in ArcGIS Pro.
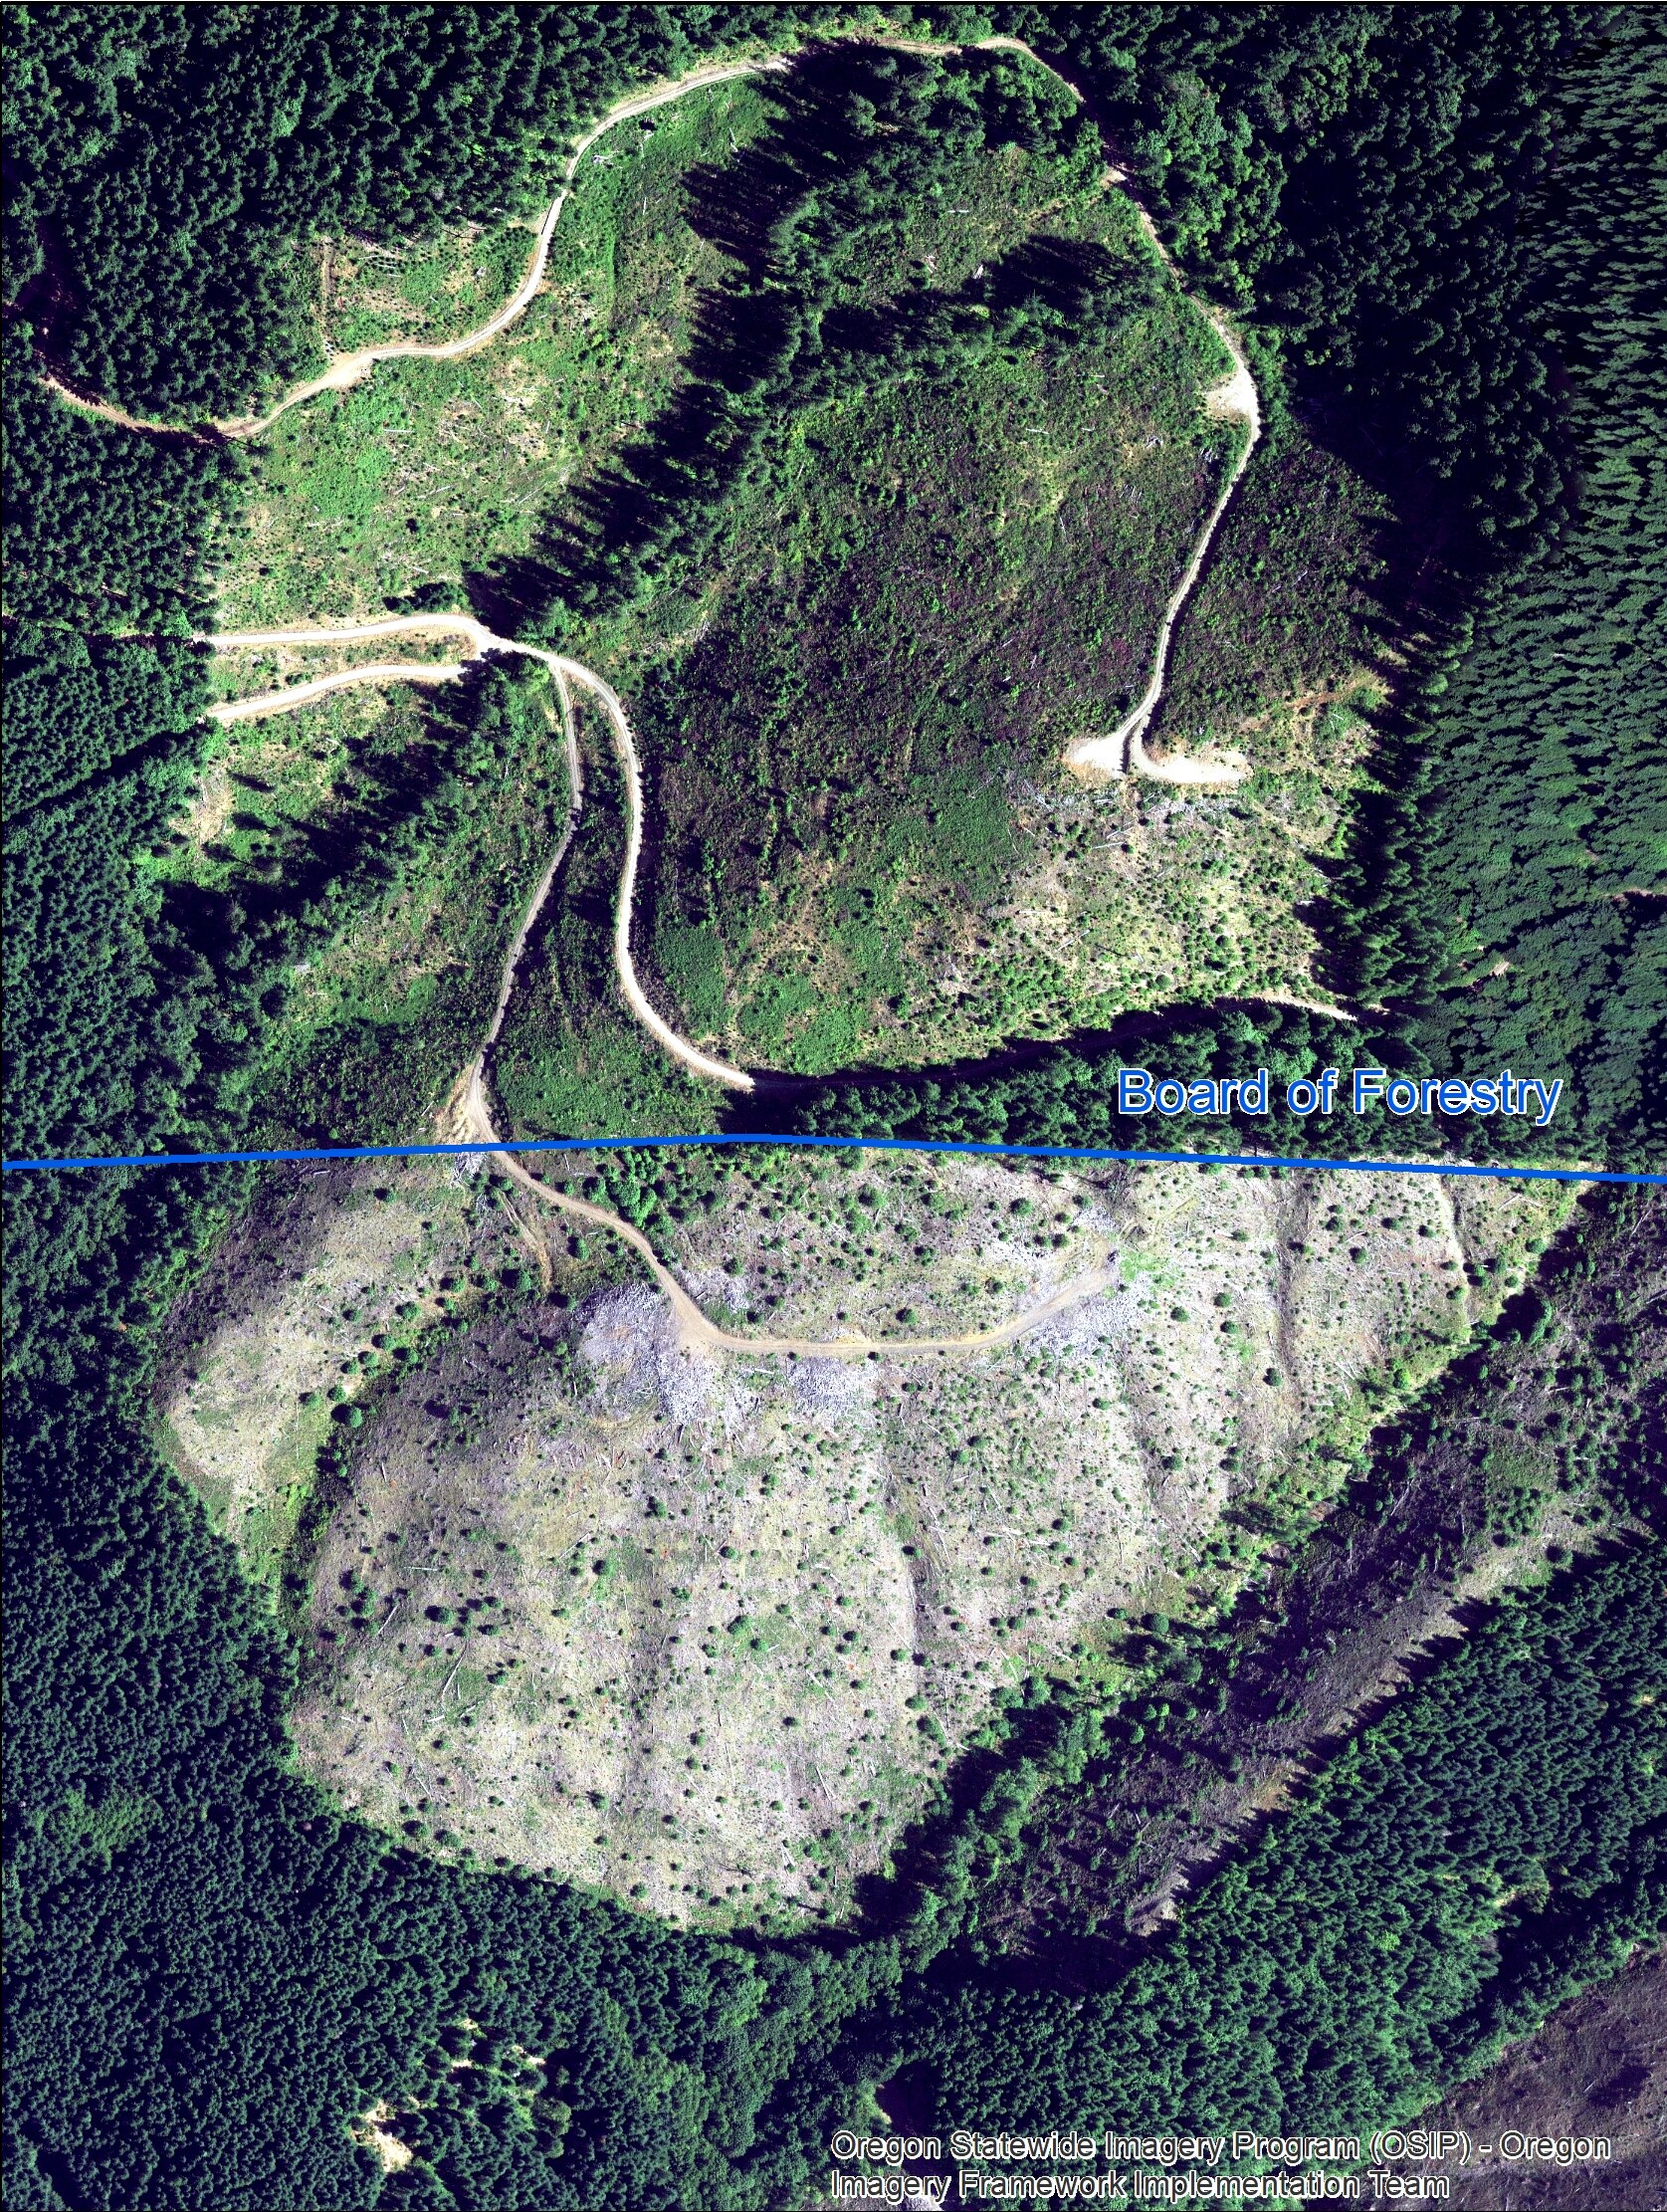
These two graphics were made for the purpose of a legal deposition, wherein it was requested that I perform a spatial analysis to compare the forest health of newly planted seedlings on State Forests lands with the forest health of newly planted seedlings private lands.
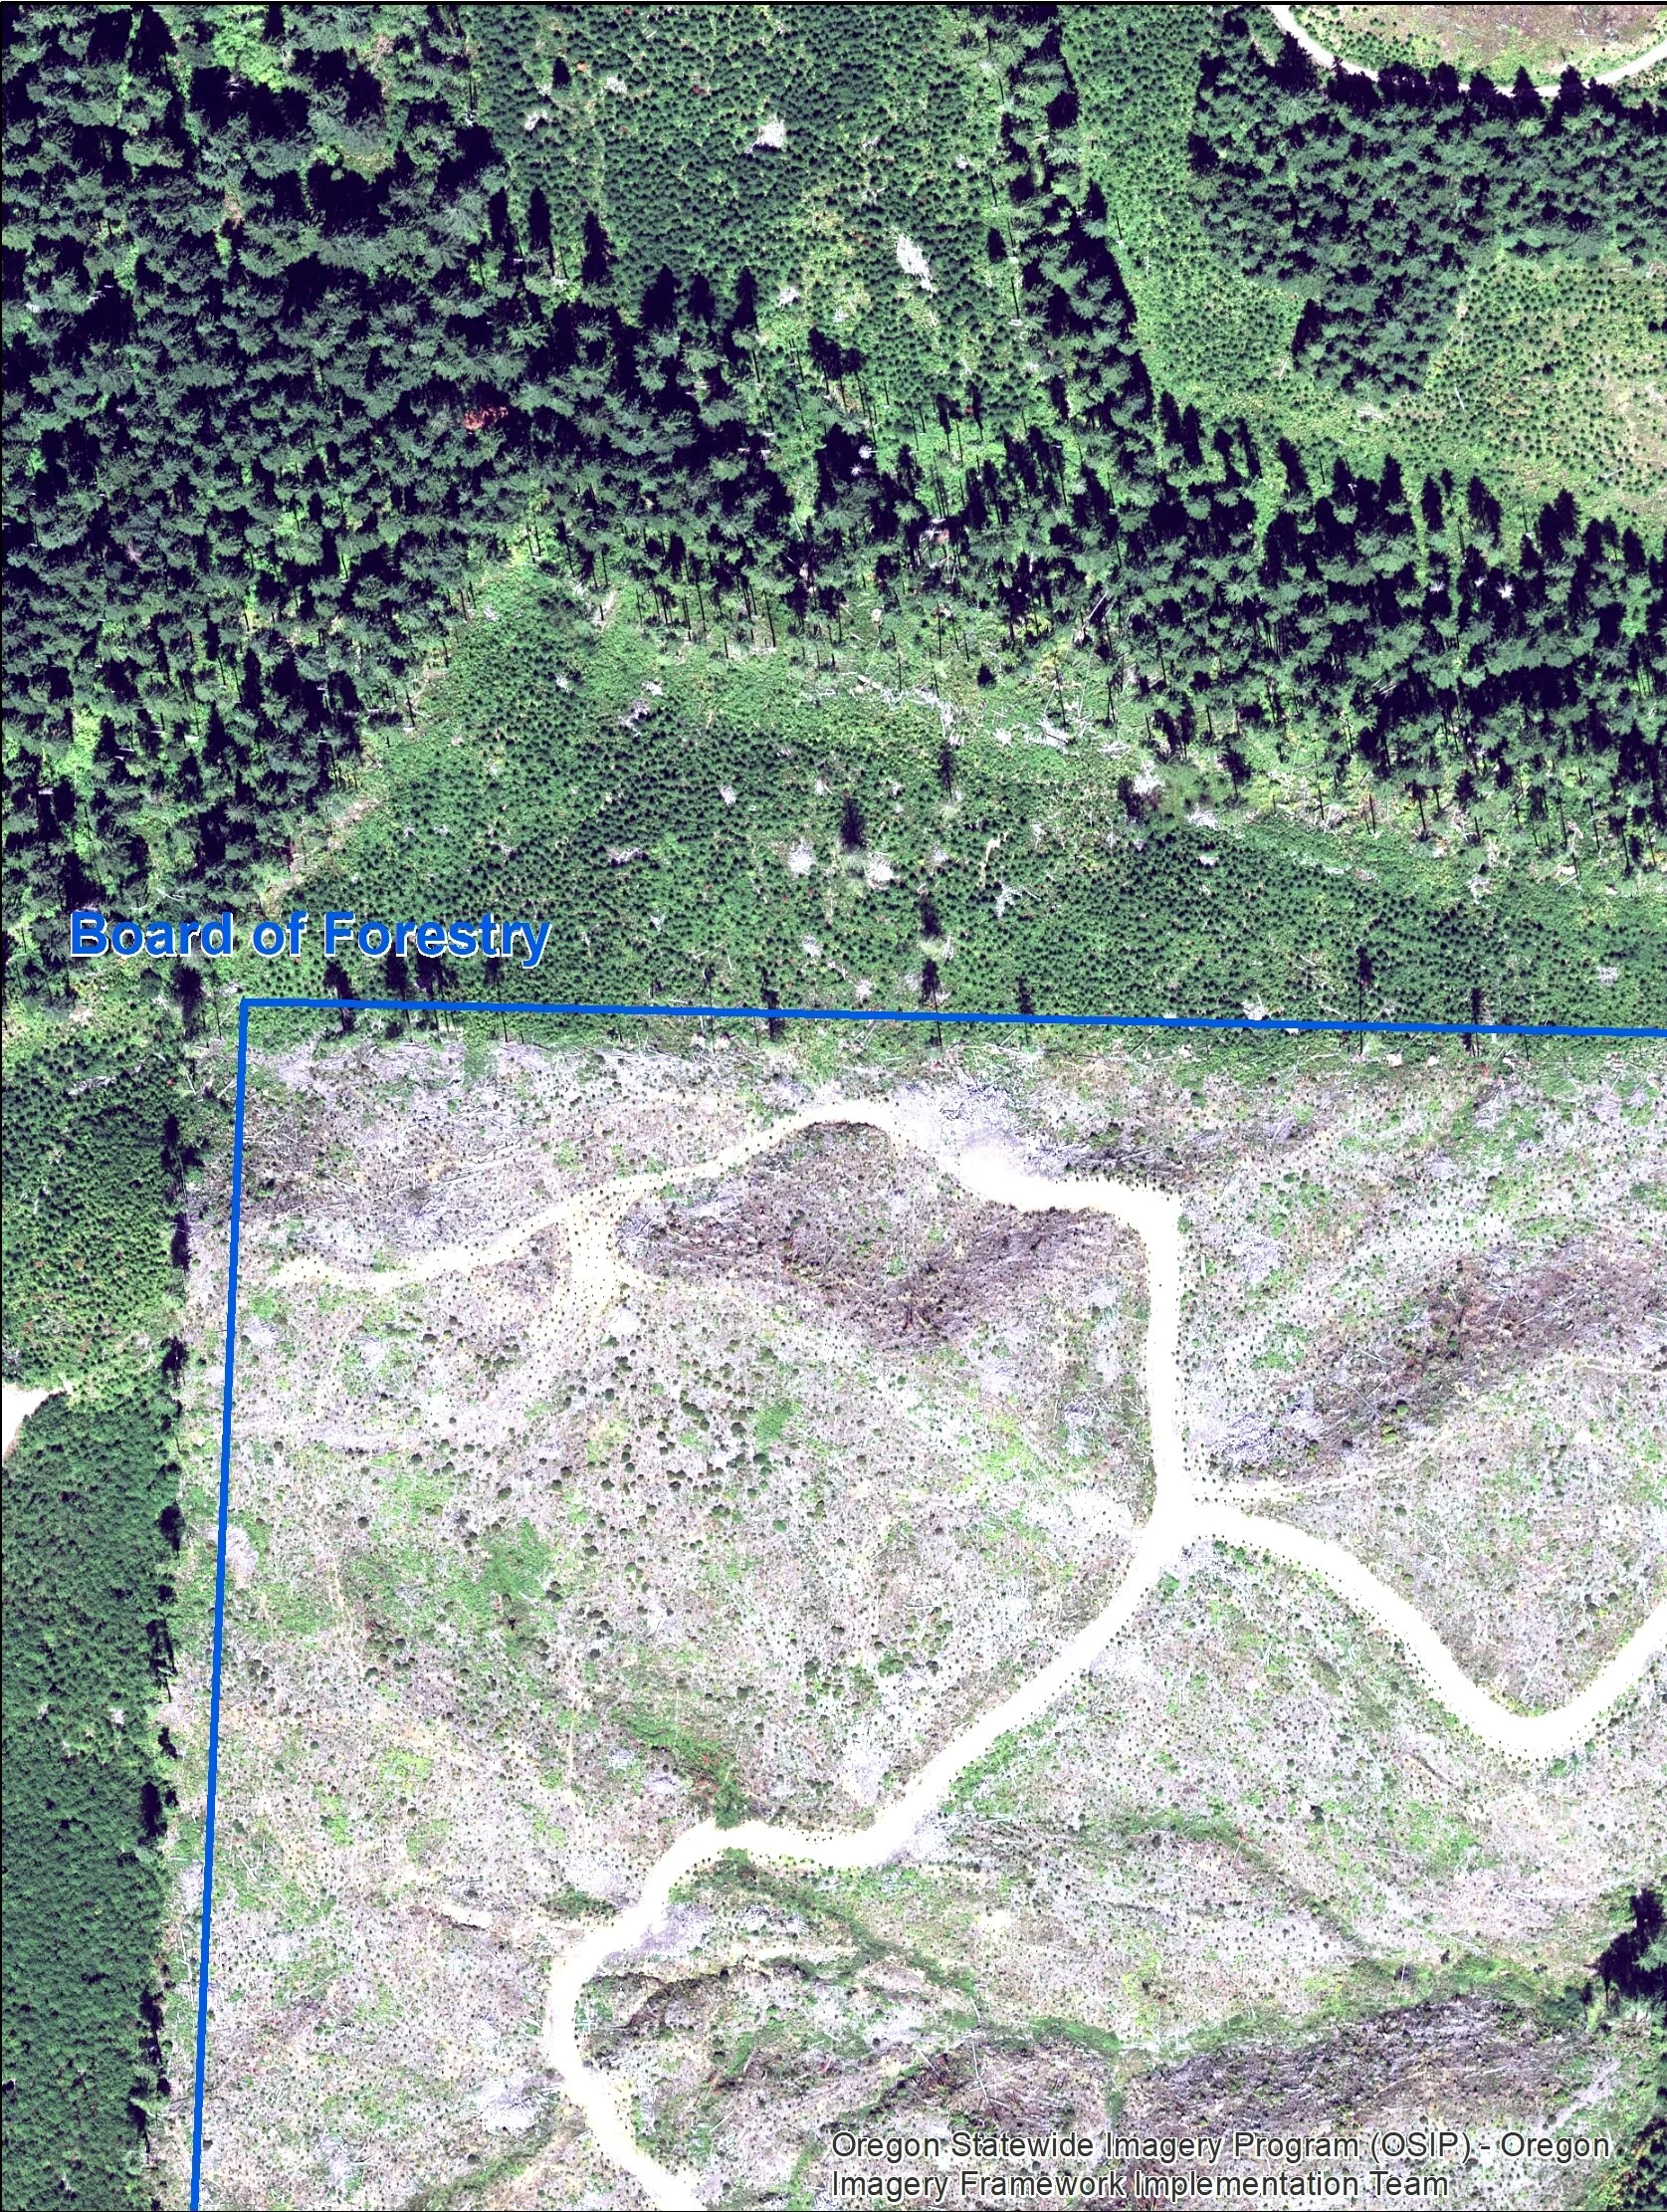
These two graphics were made for the purpose of a legal deposition, wherein it was requested that I perform a spatial analysis to compare the forest health of newly planted seedlings on State Forests lands with the forest health of newly planted seedlings private lands.
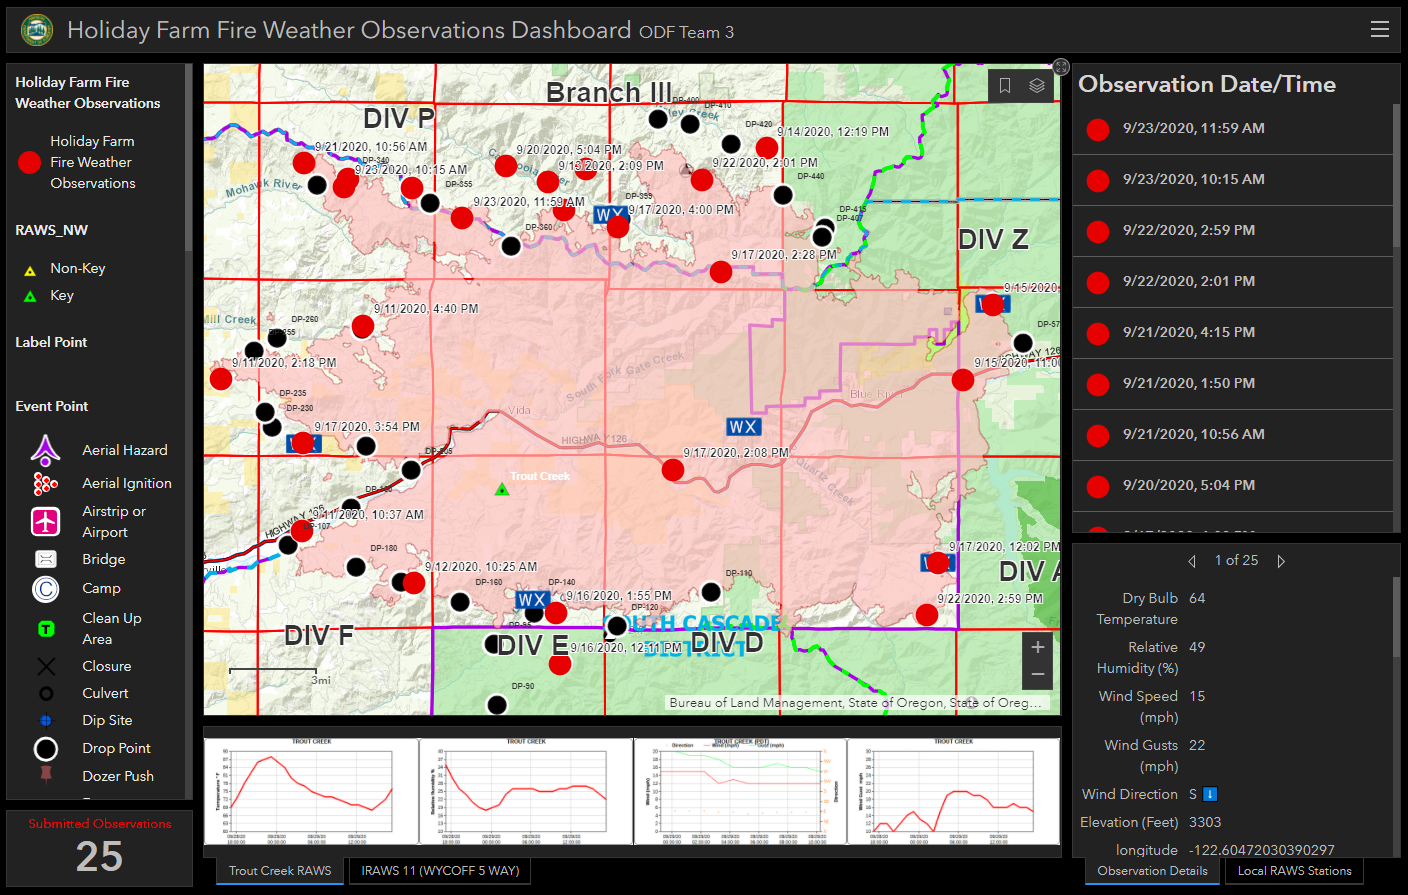
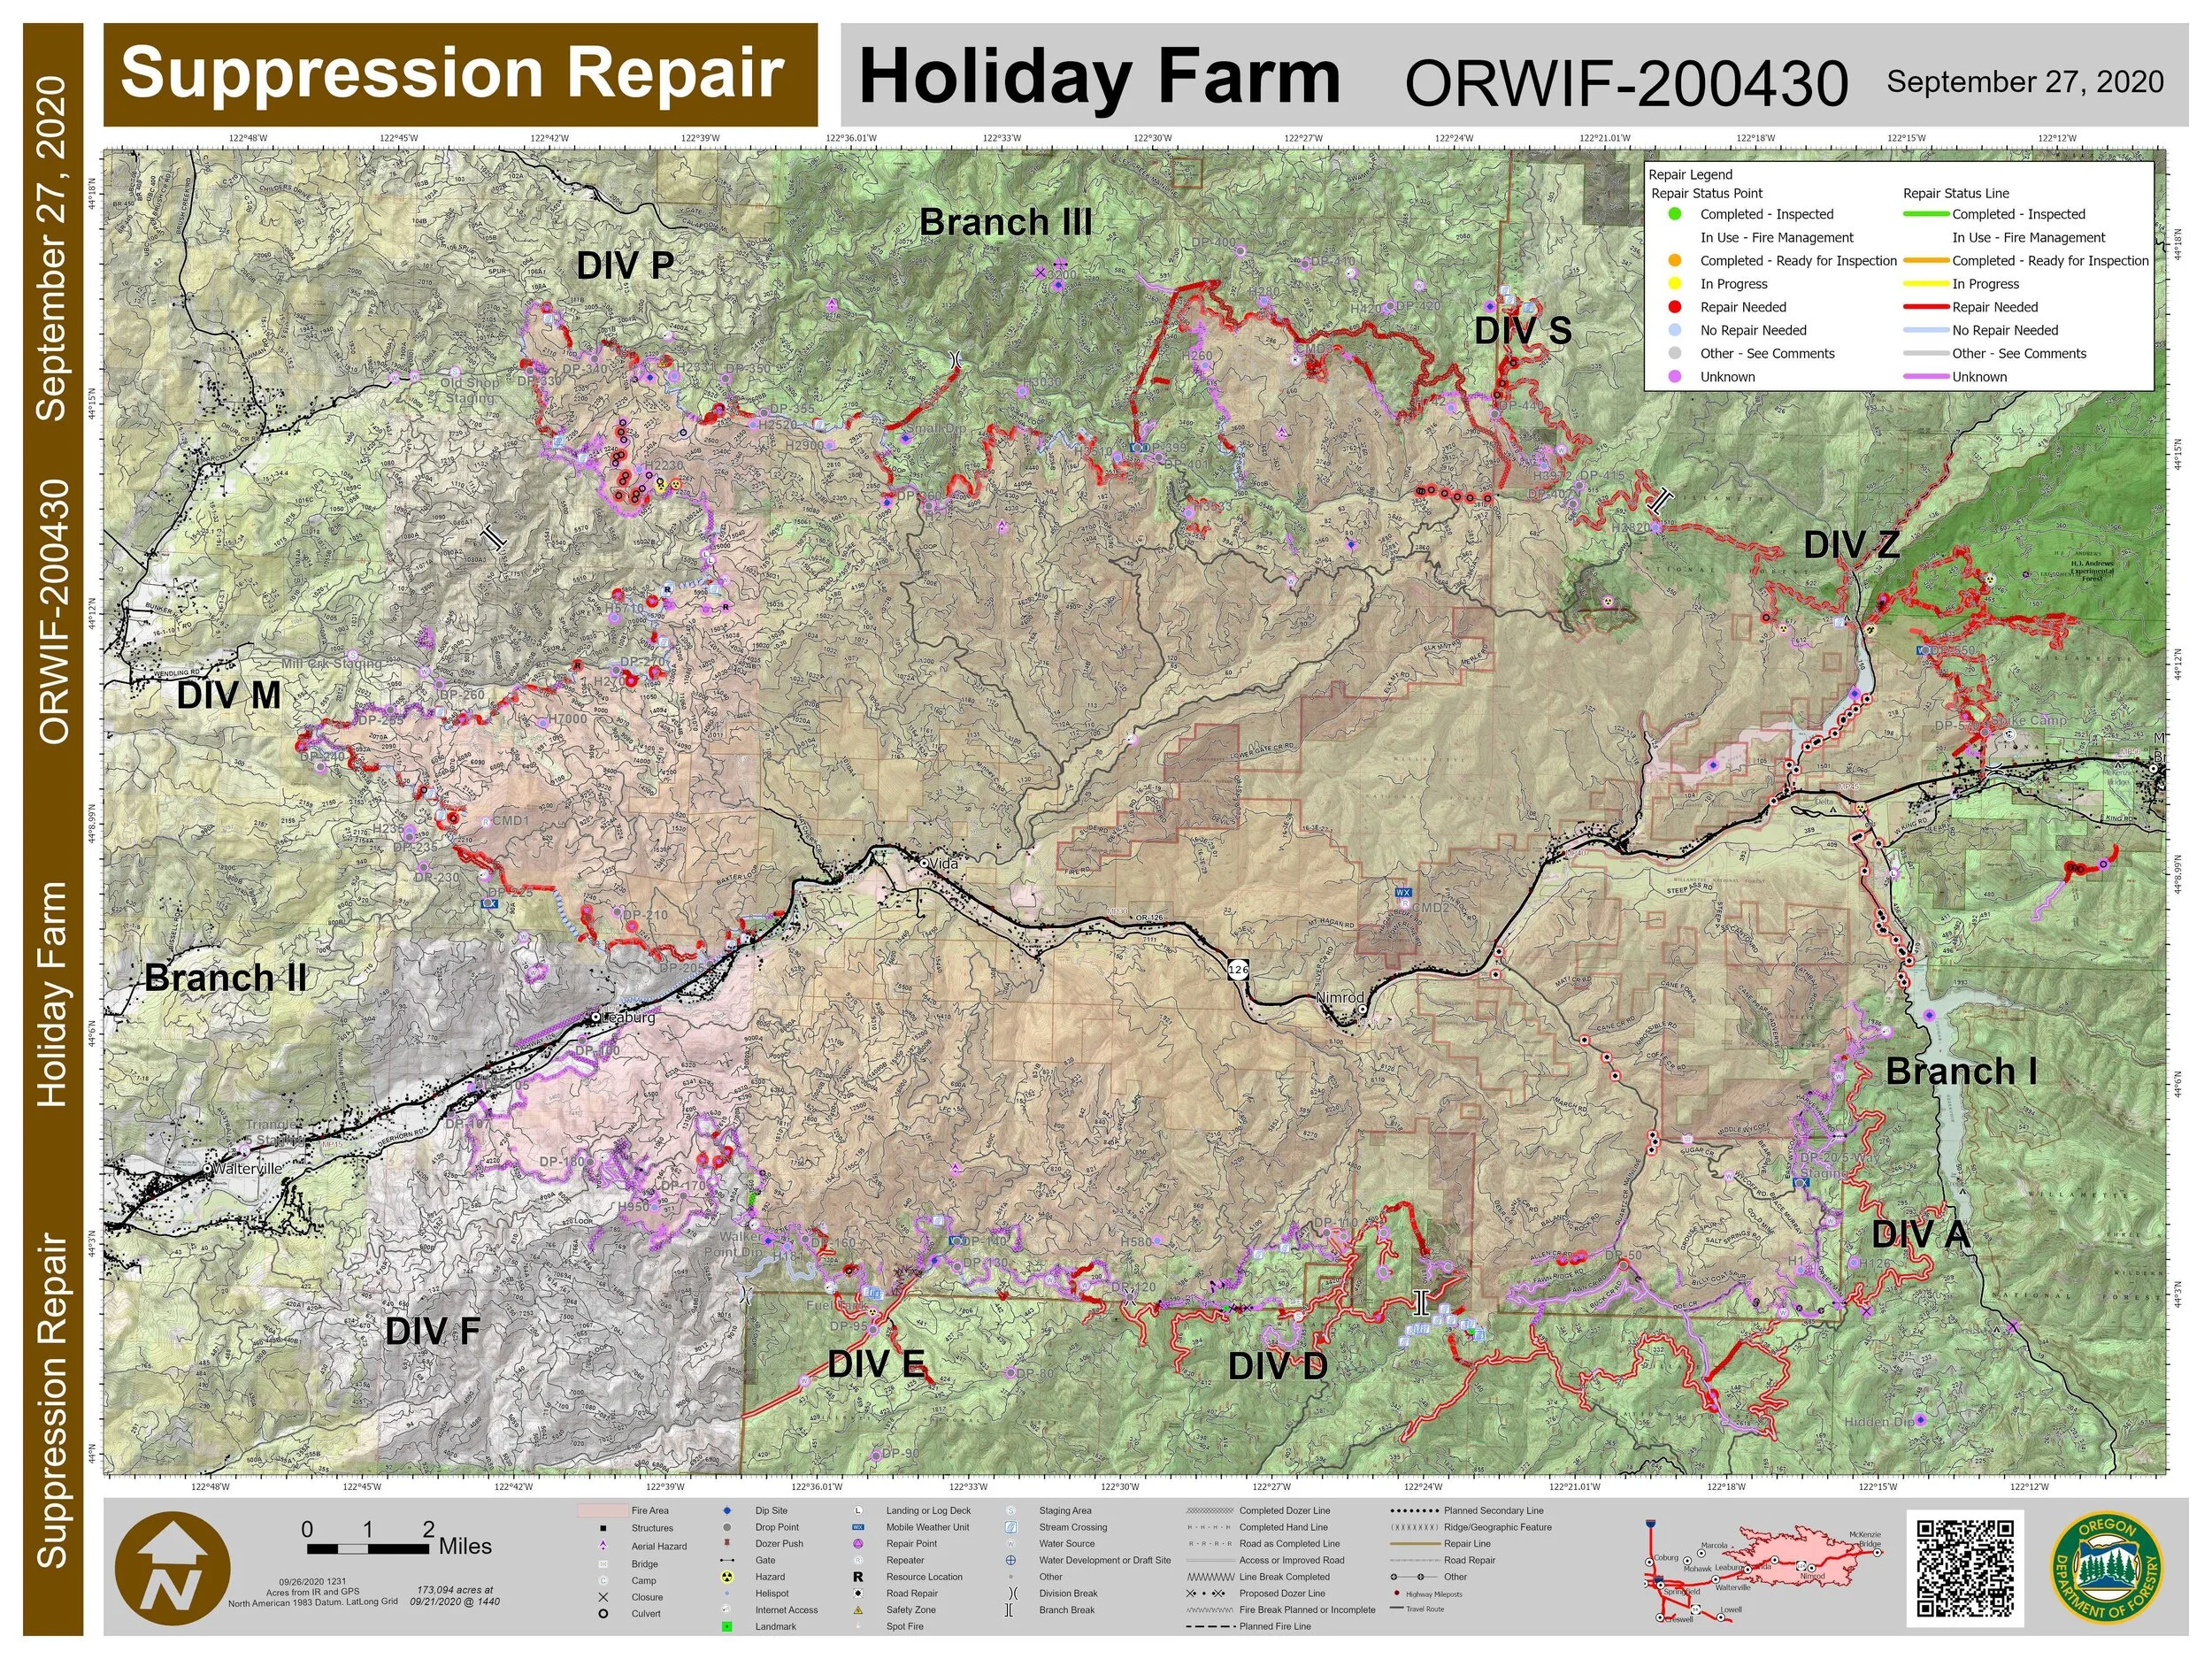
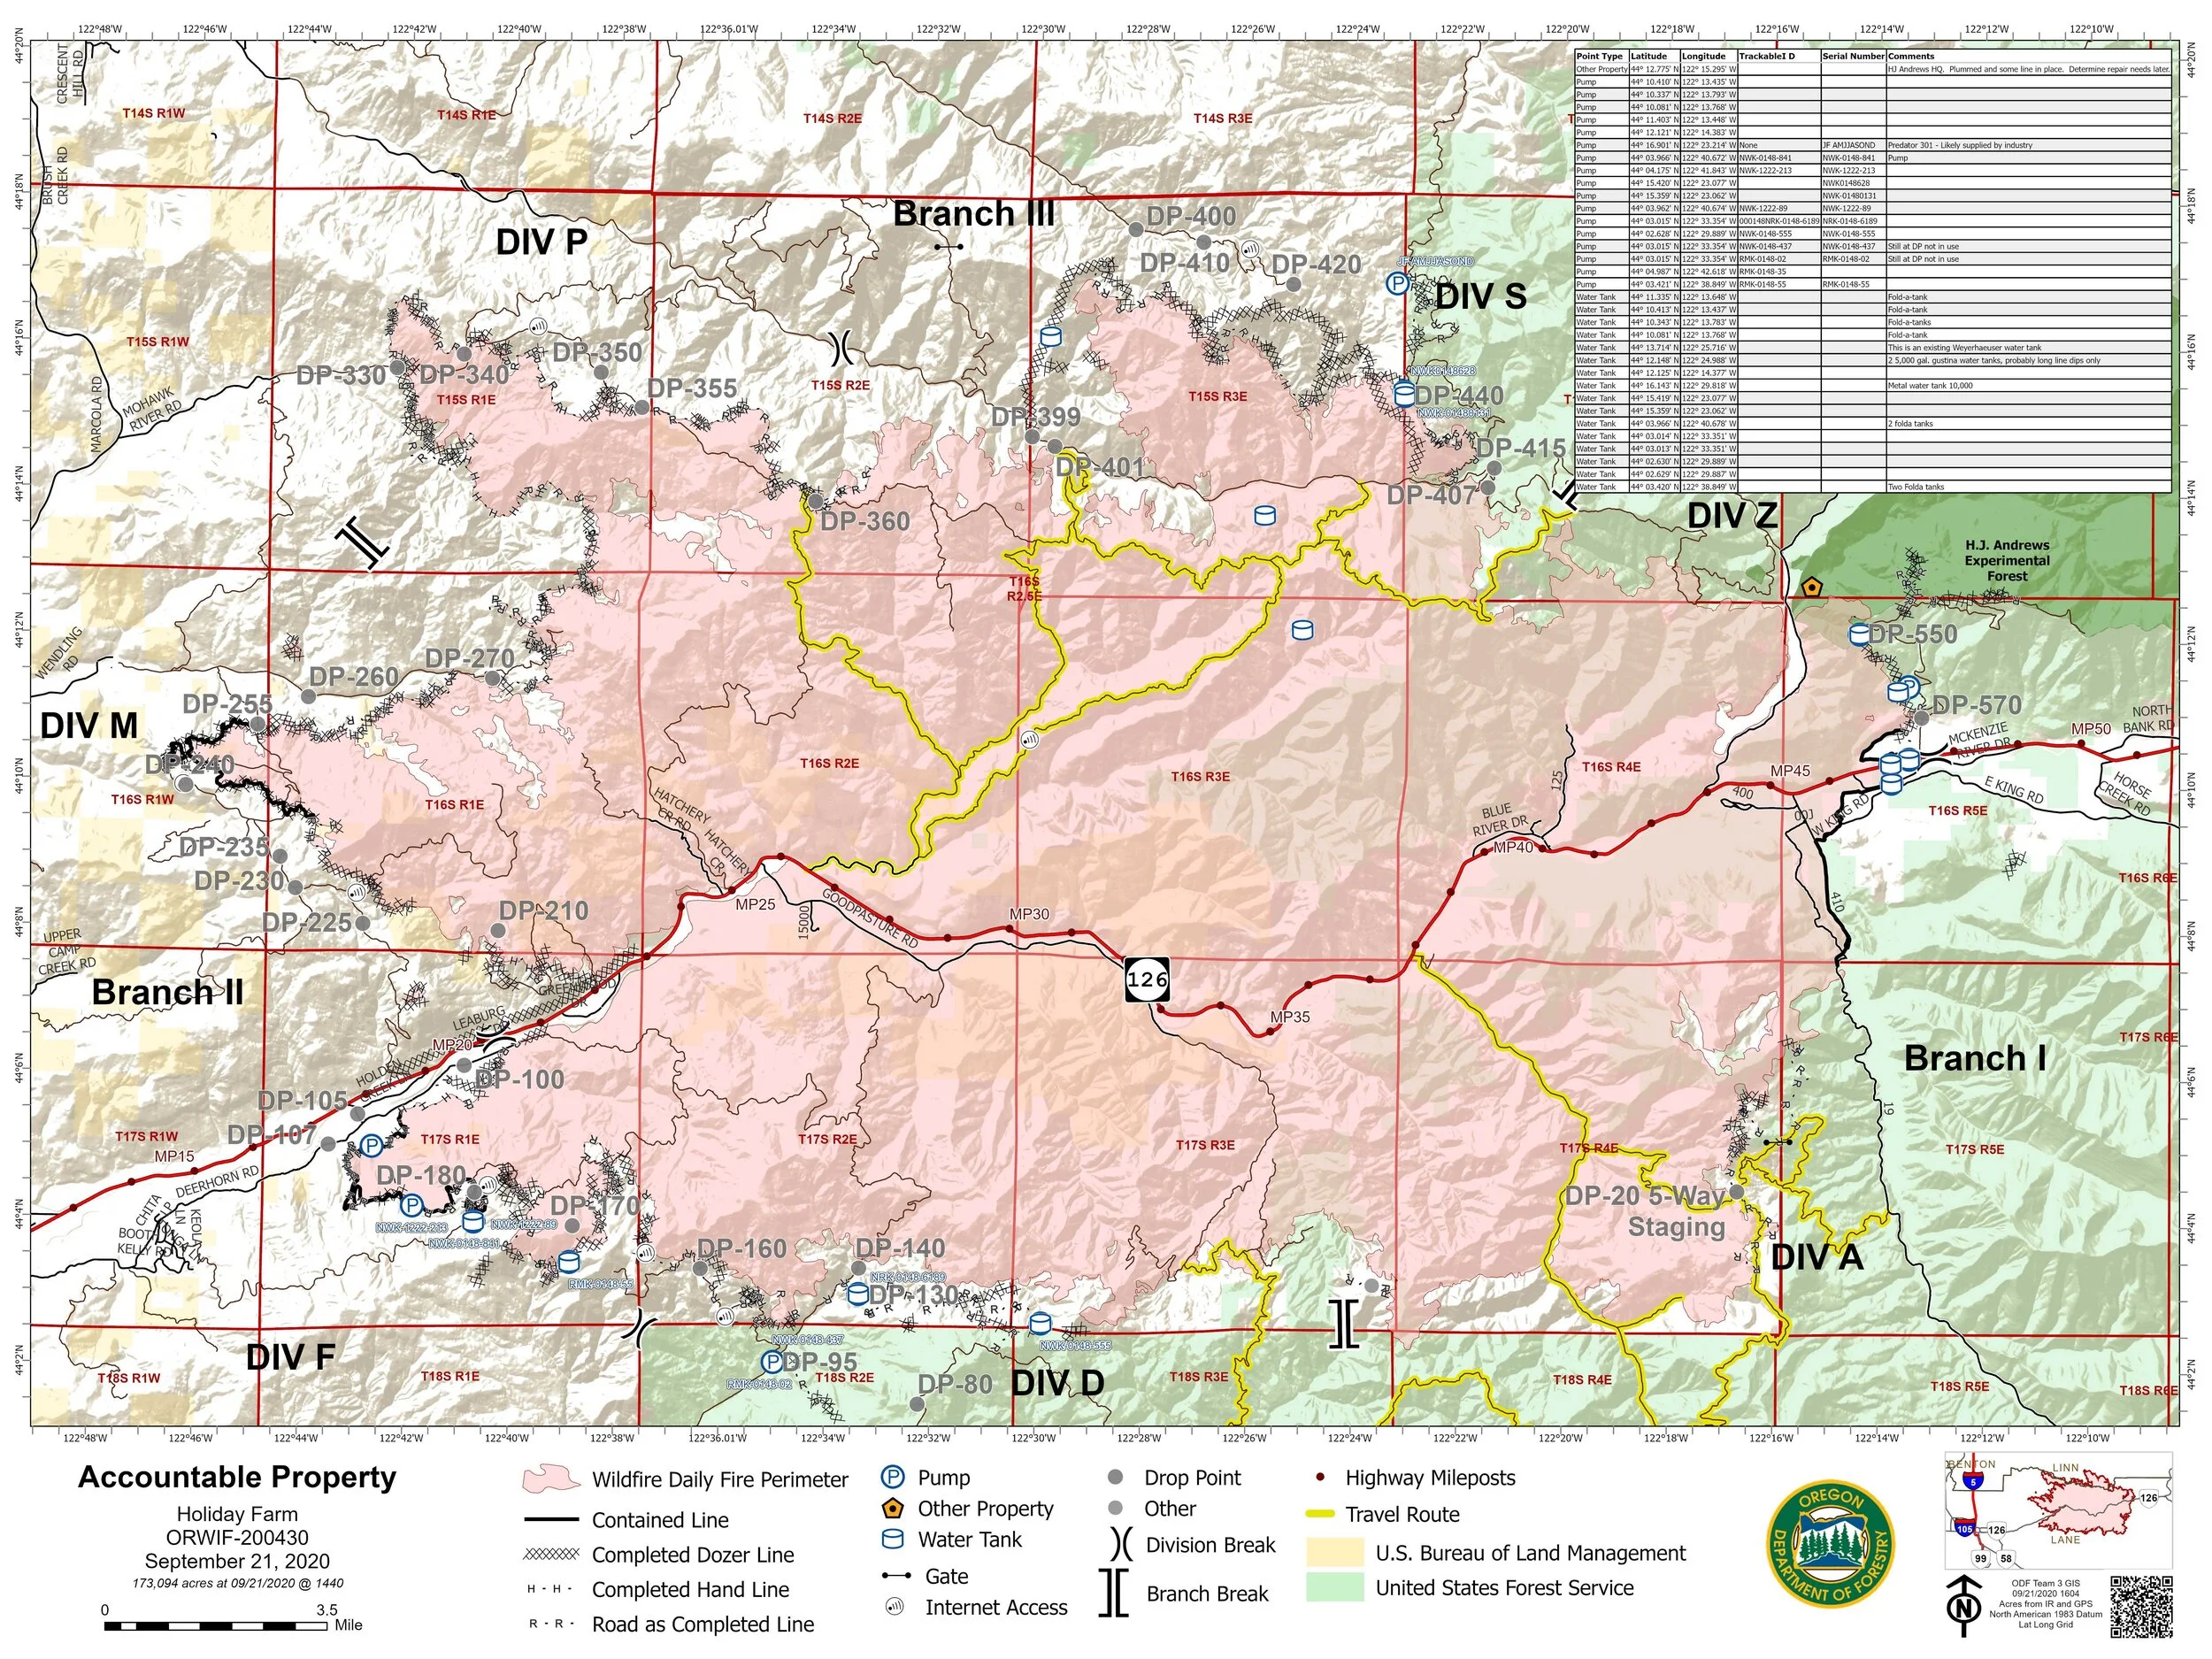
At the peak of the 2020 fire season, I was dispatched to serve as a GISS(t) on the Holiday Farm Fire. During this assignment I was tasked with managing many projects at once. A few of these tasks included:
- daily production of professional quality cartographic products to be used by emergency ground resources
-designing, building and deploying mobile data collection solutions in Survey123 and Collector
- designing and building applications within the AGOL environment to allow fire managers to analyze live fire data
This incident was a dynamic emergency situation where I was tasked with working remotely in a virtual environment while maintaining lines of communication with many members of many teams collecting data in the field and compiling that data to report to fire managers efficiently and accurately.

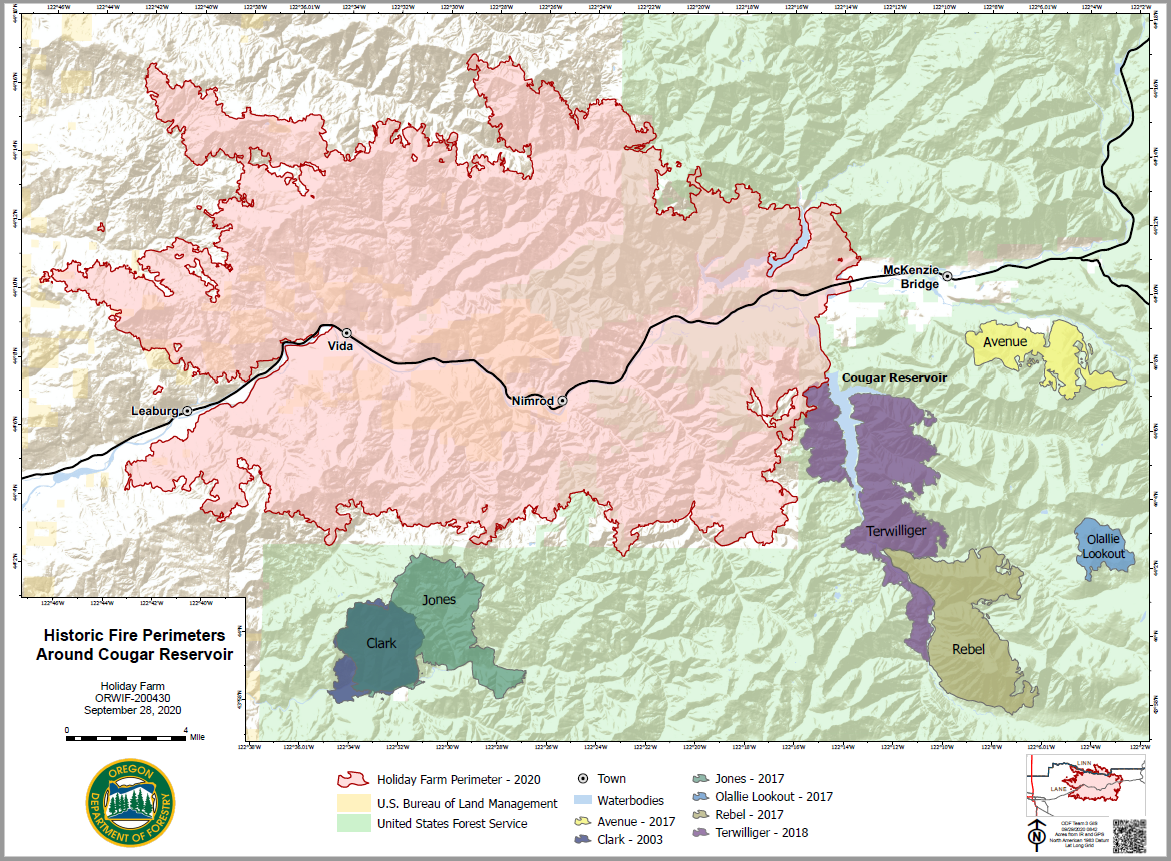
This map is part of a series that was published in the Oregon Department of Forestry’s 100-year Forest Management Plan. This is an excellent example of my experience collaborating with multiple stakeholders to publish a map document worthy of being published in a historical document intended for public consumption.
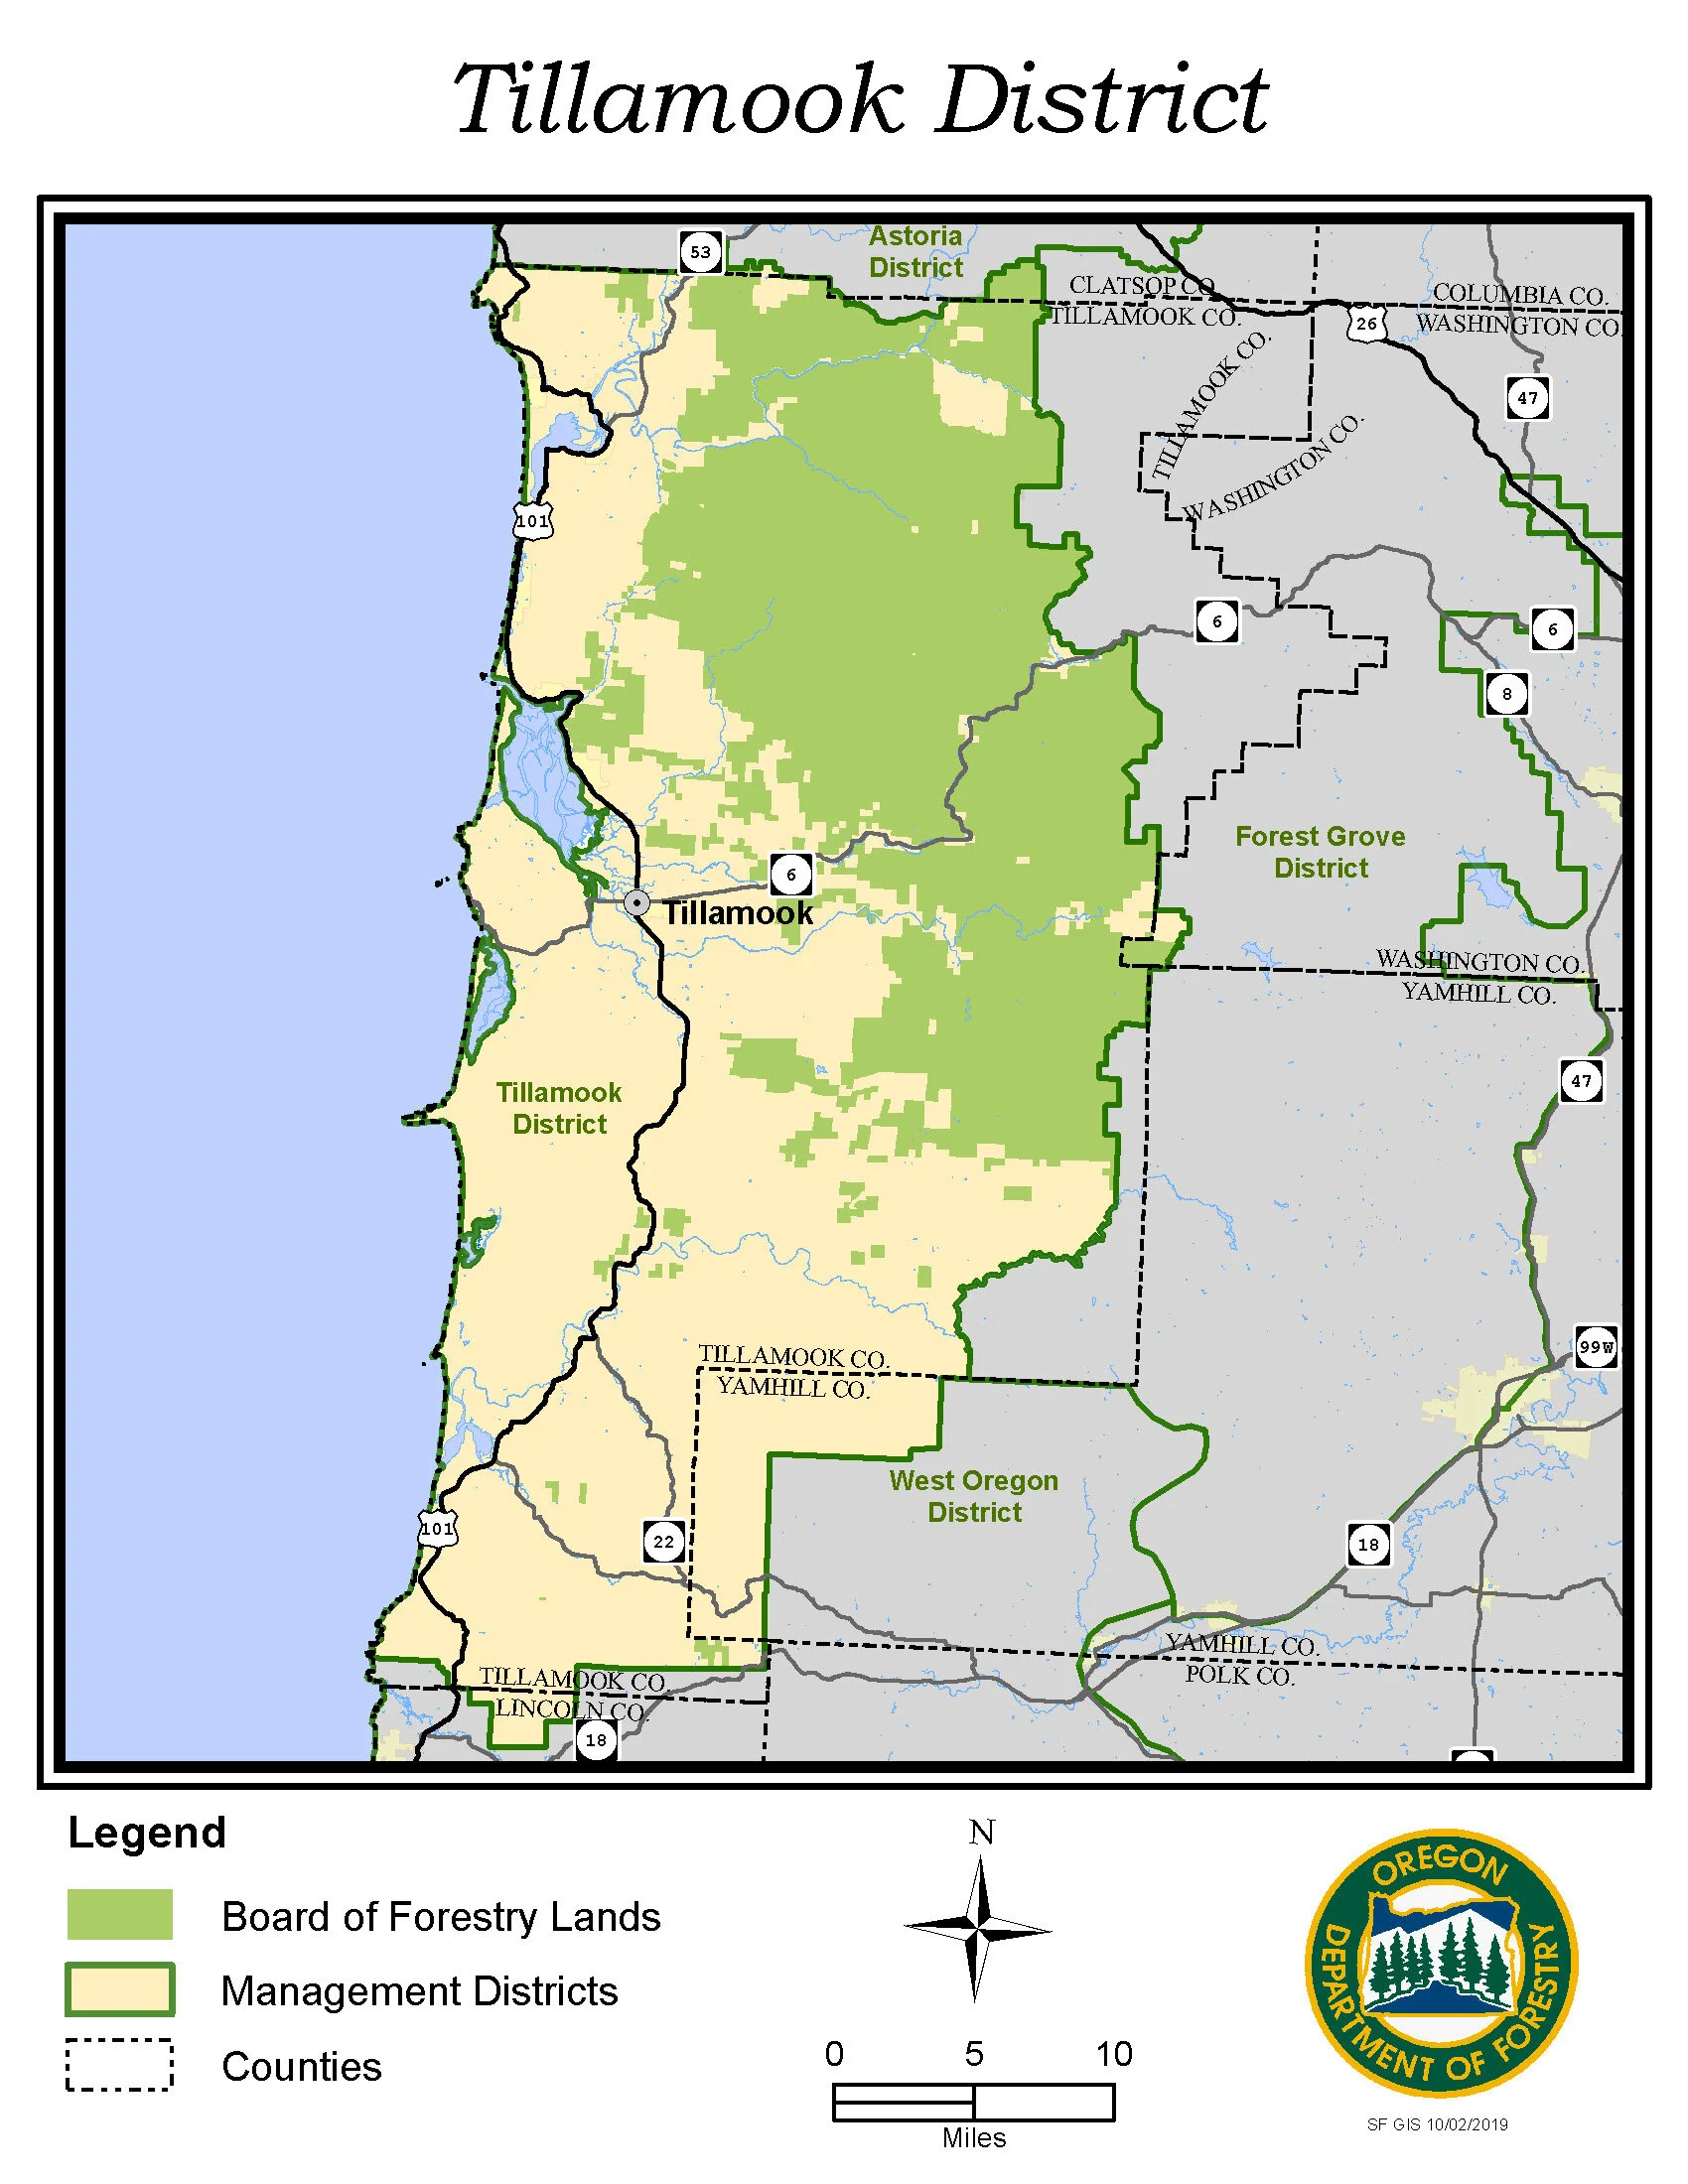
This map is part of a series that was published in the Oregon Department of Forestry’s 100-year Forest Management Plan. This is an excellent example of my experience collaborating with multiple stakeholders to publish a map document worthy of being published in a historical document intended for public consumption.
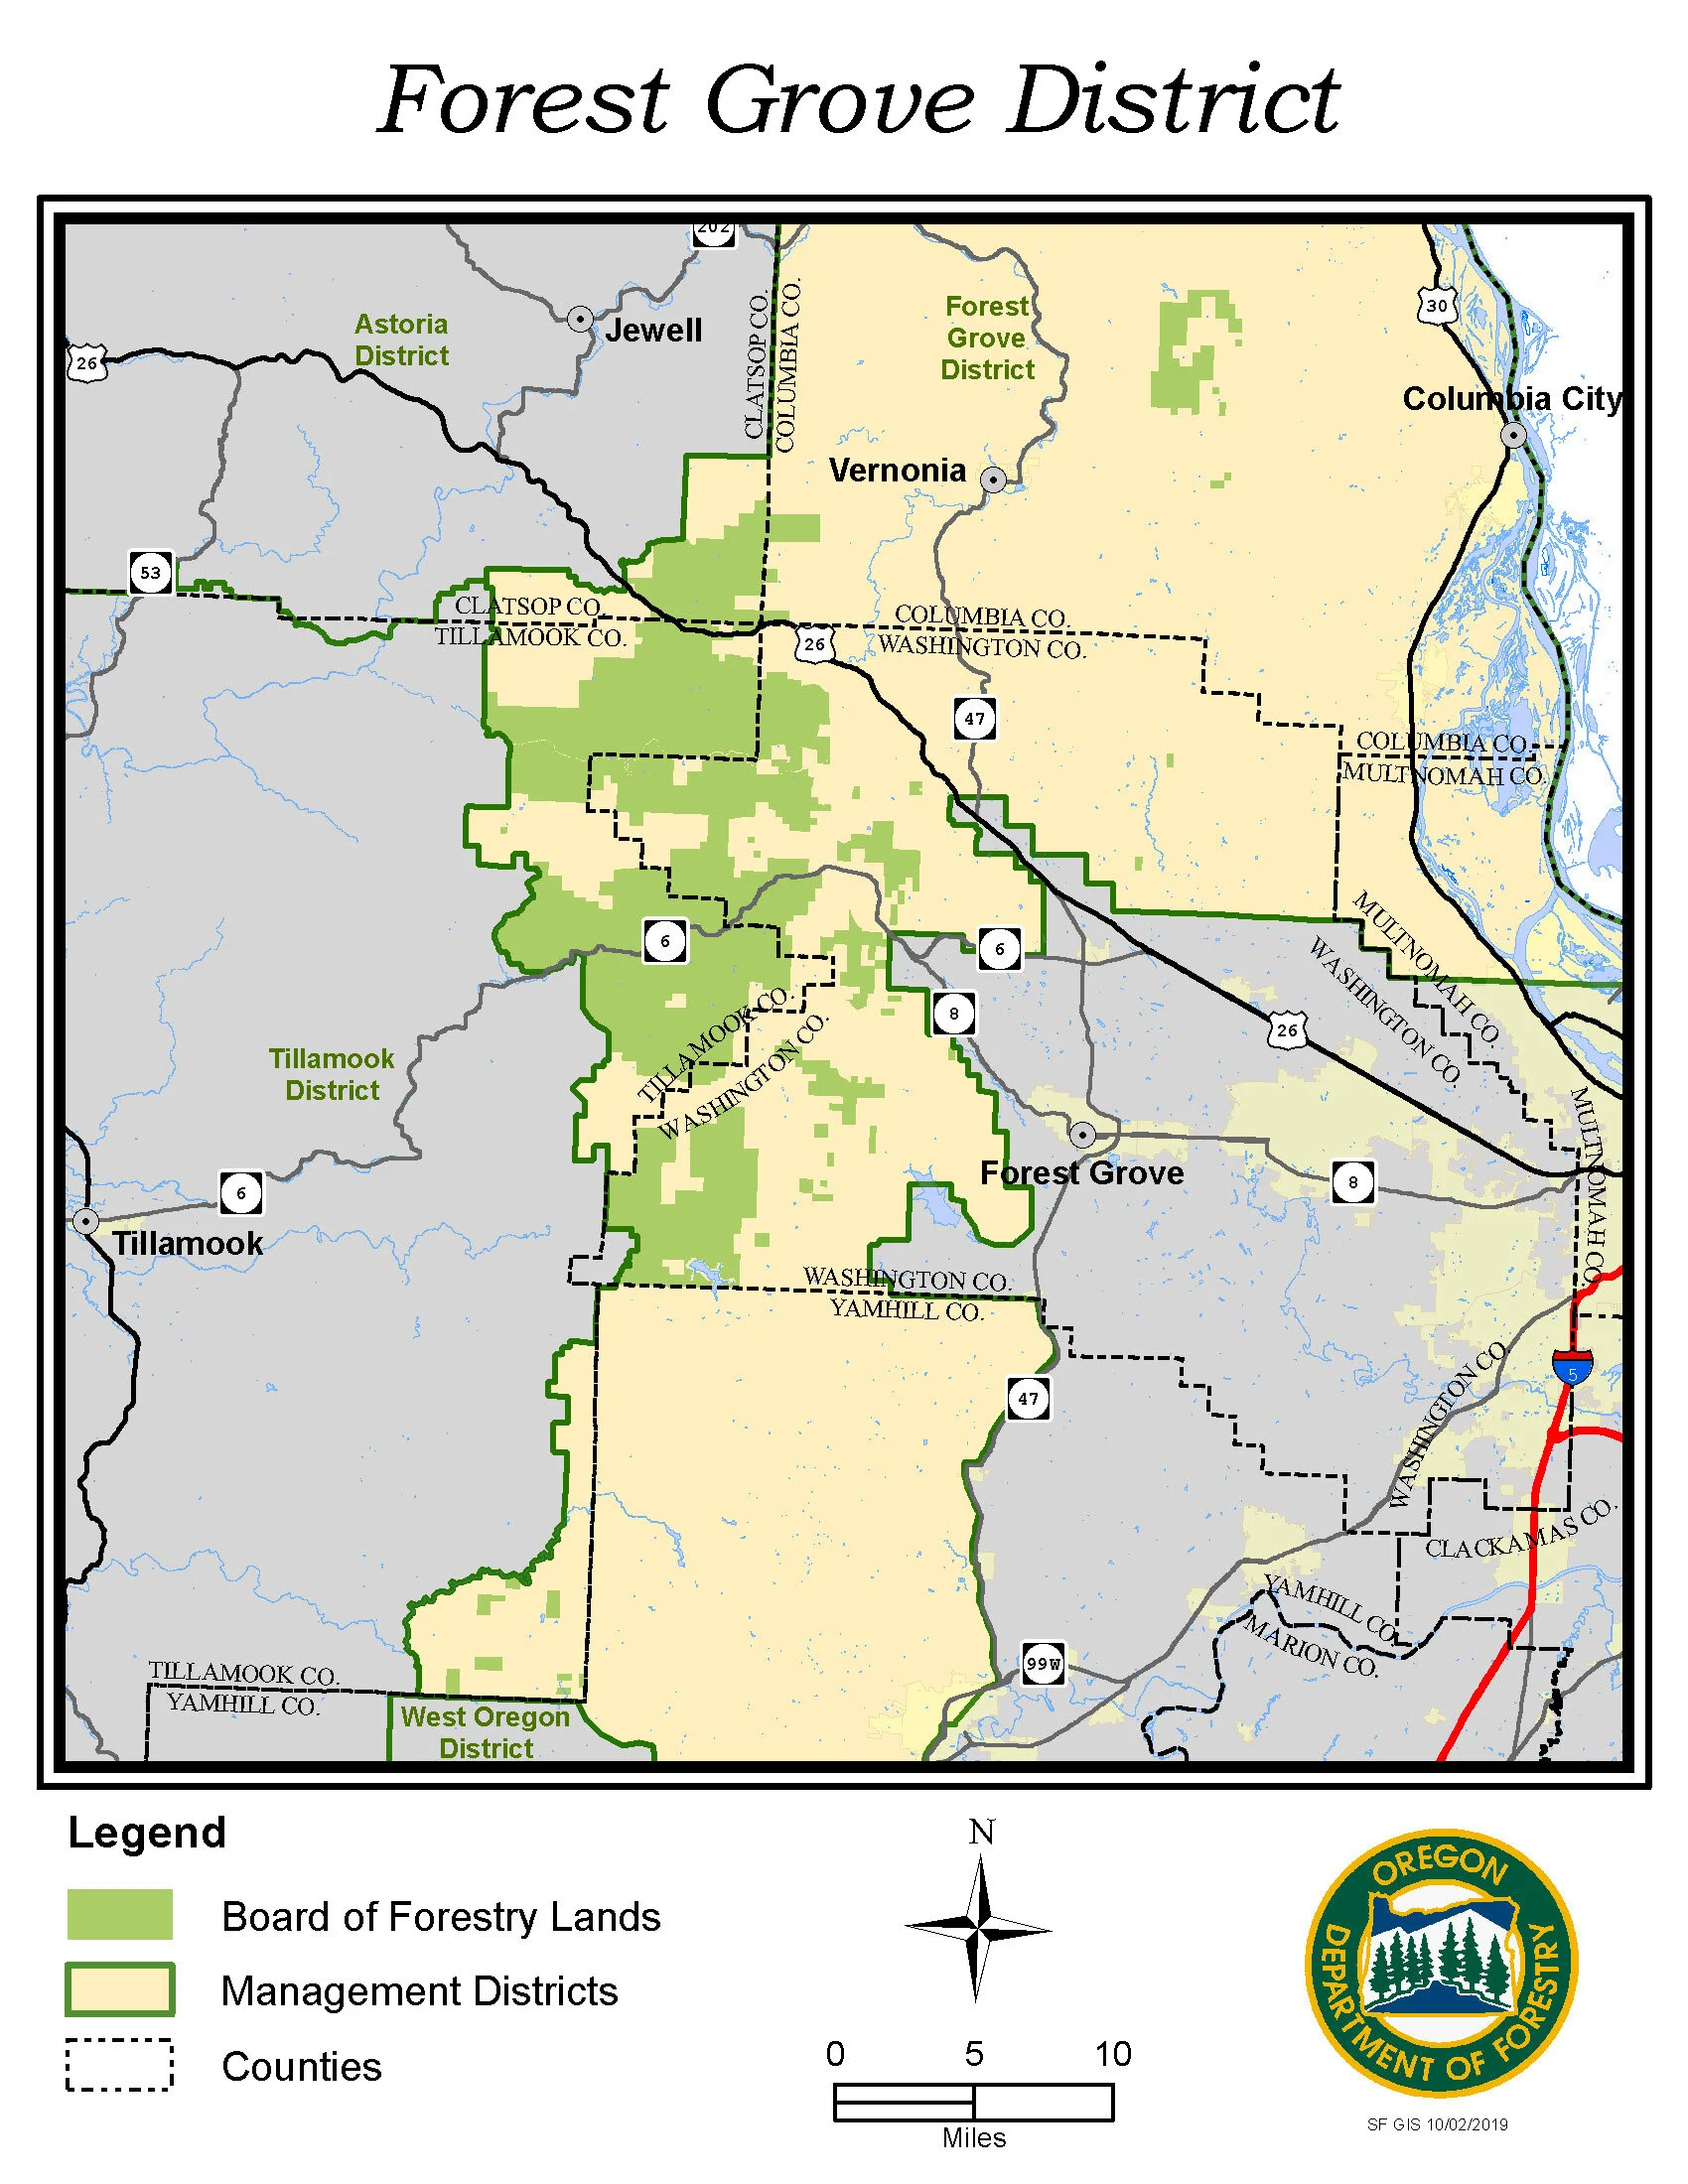
This map is part of a series that was published in the Oregon Department of Forestry’s 100-year Forest Management Plan. This is an excellent example of my experience collaborating with multiple stakeholders to publish a map document worthy of being published in a historical document intended for public consumption.
This map is part of a series that was published in the Oregon Department of Forestry’s 100-year Forest Management Plan. This is an excellent example of my experience collaborating with multiple stakeholders to publish a map document worthy of being published in a historical document intended for public consumption.
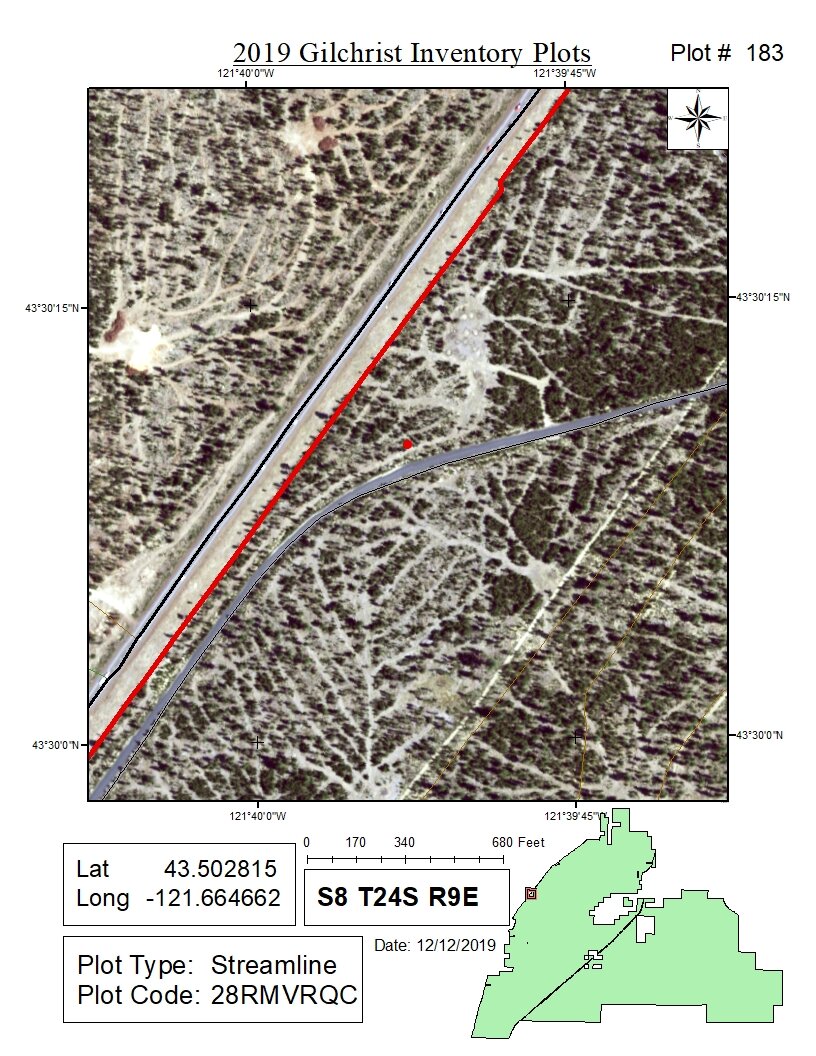
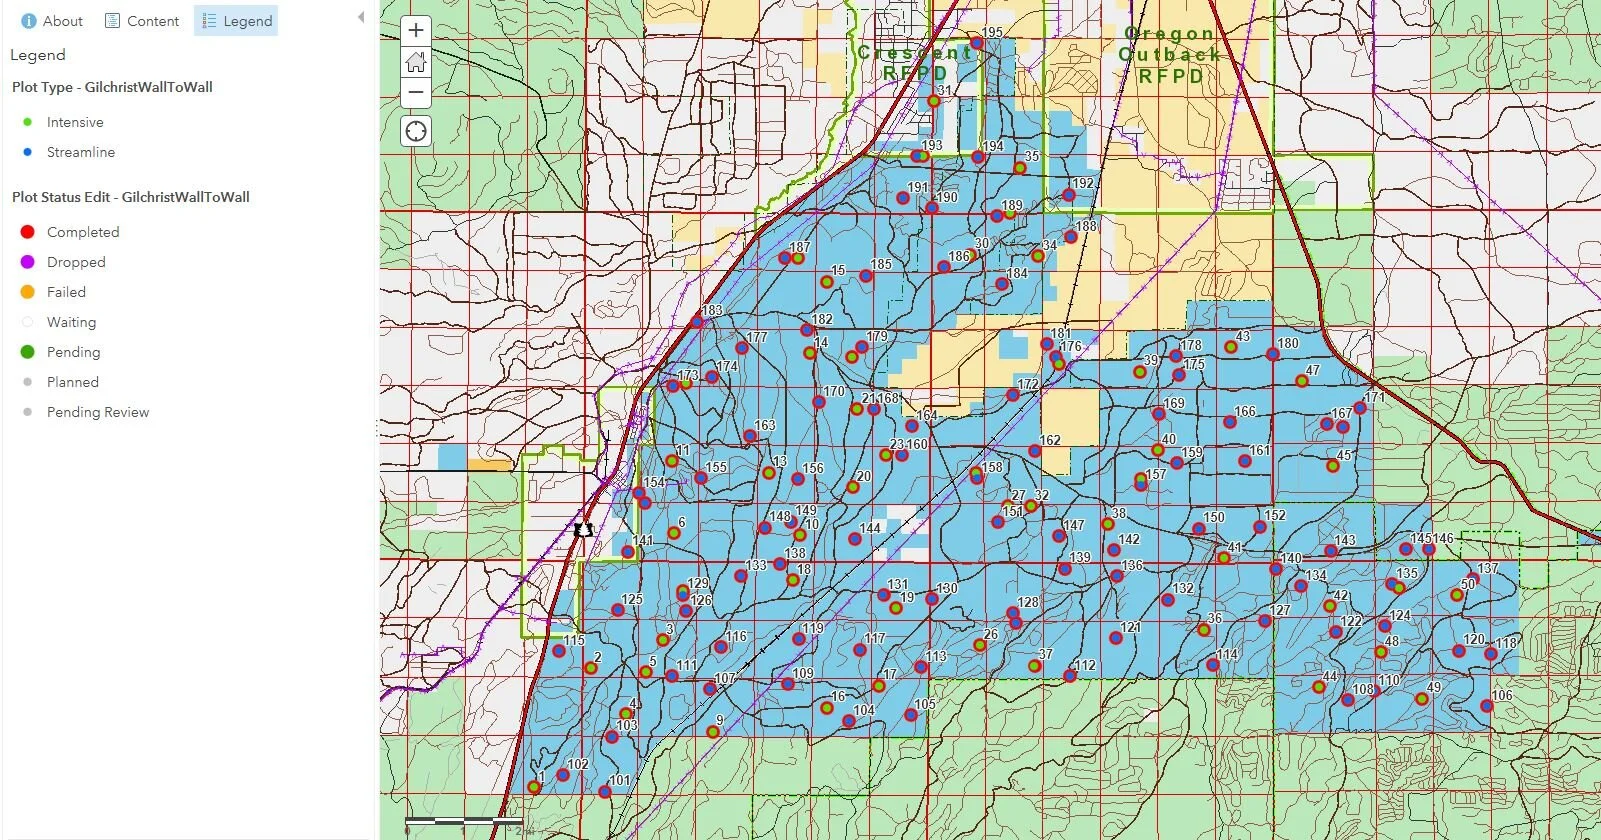
This is one of many maps created for the Inventory and Monitoring Unit at the Oregon Department of Forestry for the purpose of creating a vegetation inventory of the newly acquired Gilchrist State Forest. This particular product is a data-driven plot map, one of more than 200 produced, and an excellent example of my experience creating high quality maps that meet professional cartographic standards.
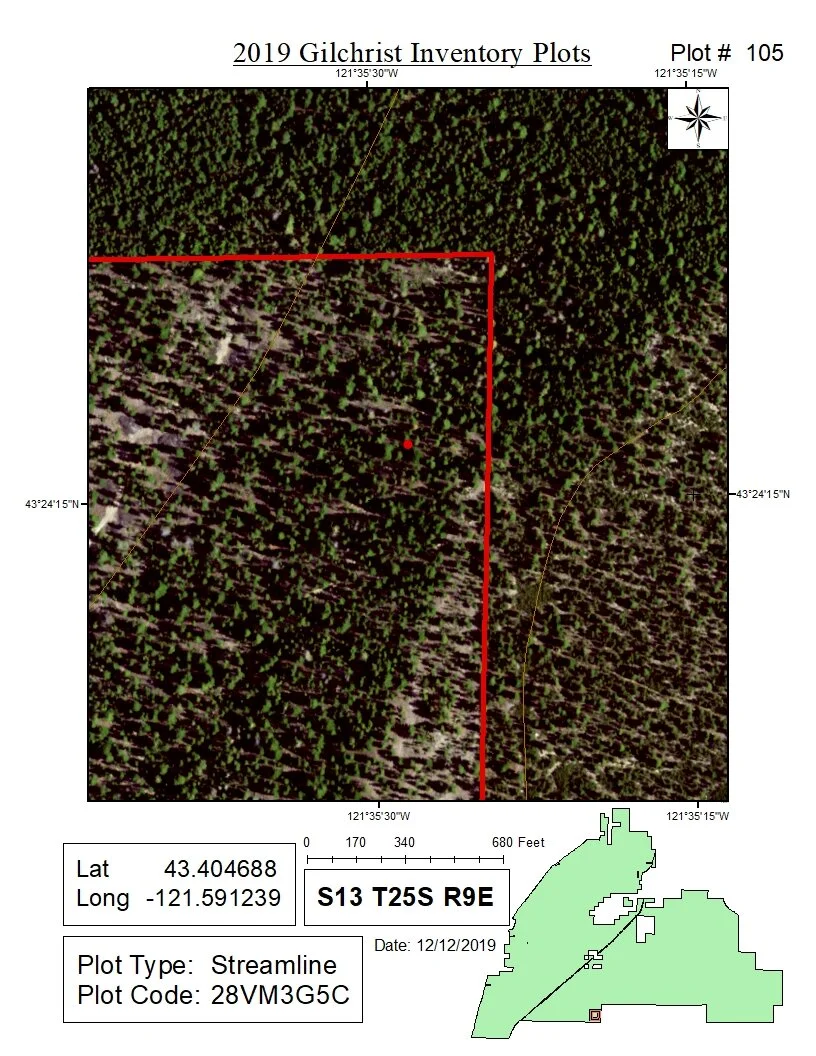
This is one of many maps created for the Inventory and Monitoring Unit at the Oregon Department of Forestry for the purpose of creating a vegetation inventory of the newly acquired Gilchrist State Forest. This particular product is a data-driven plot map, one of more than 200 produced, and an excellent example of my experience creating high quality maps that meet professional cartographic standards.
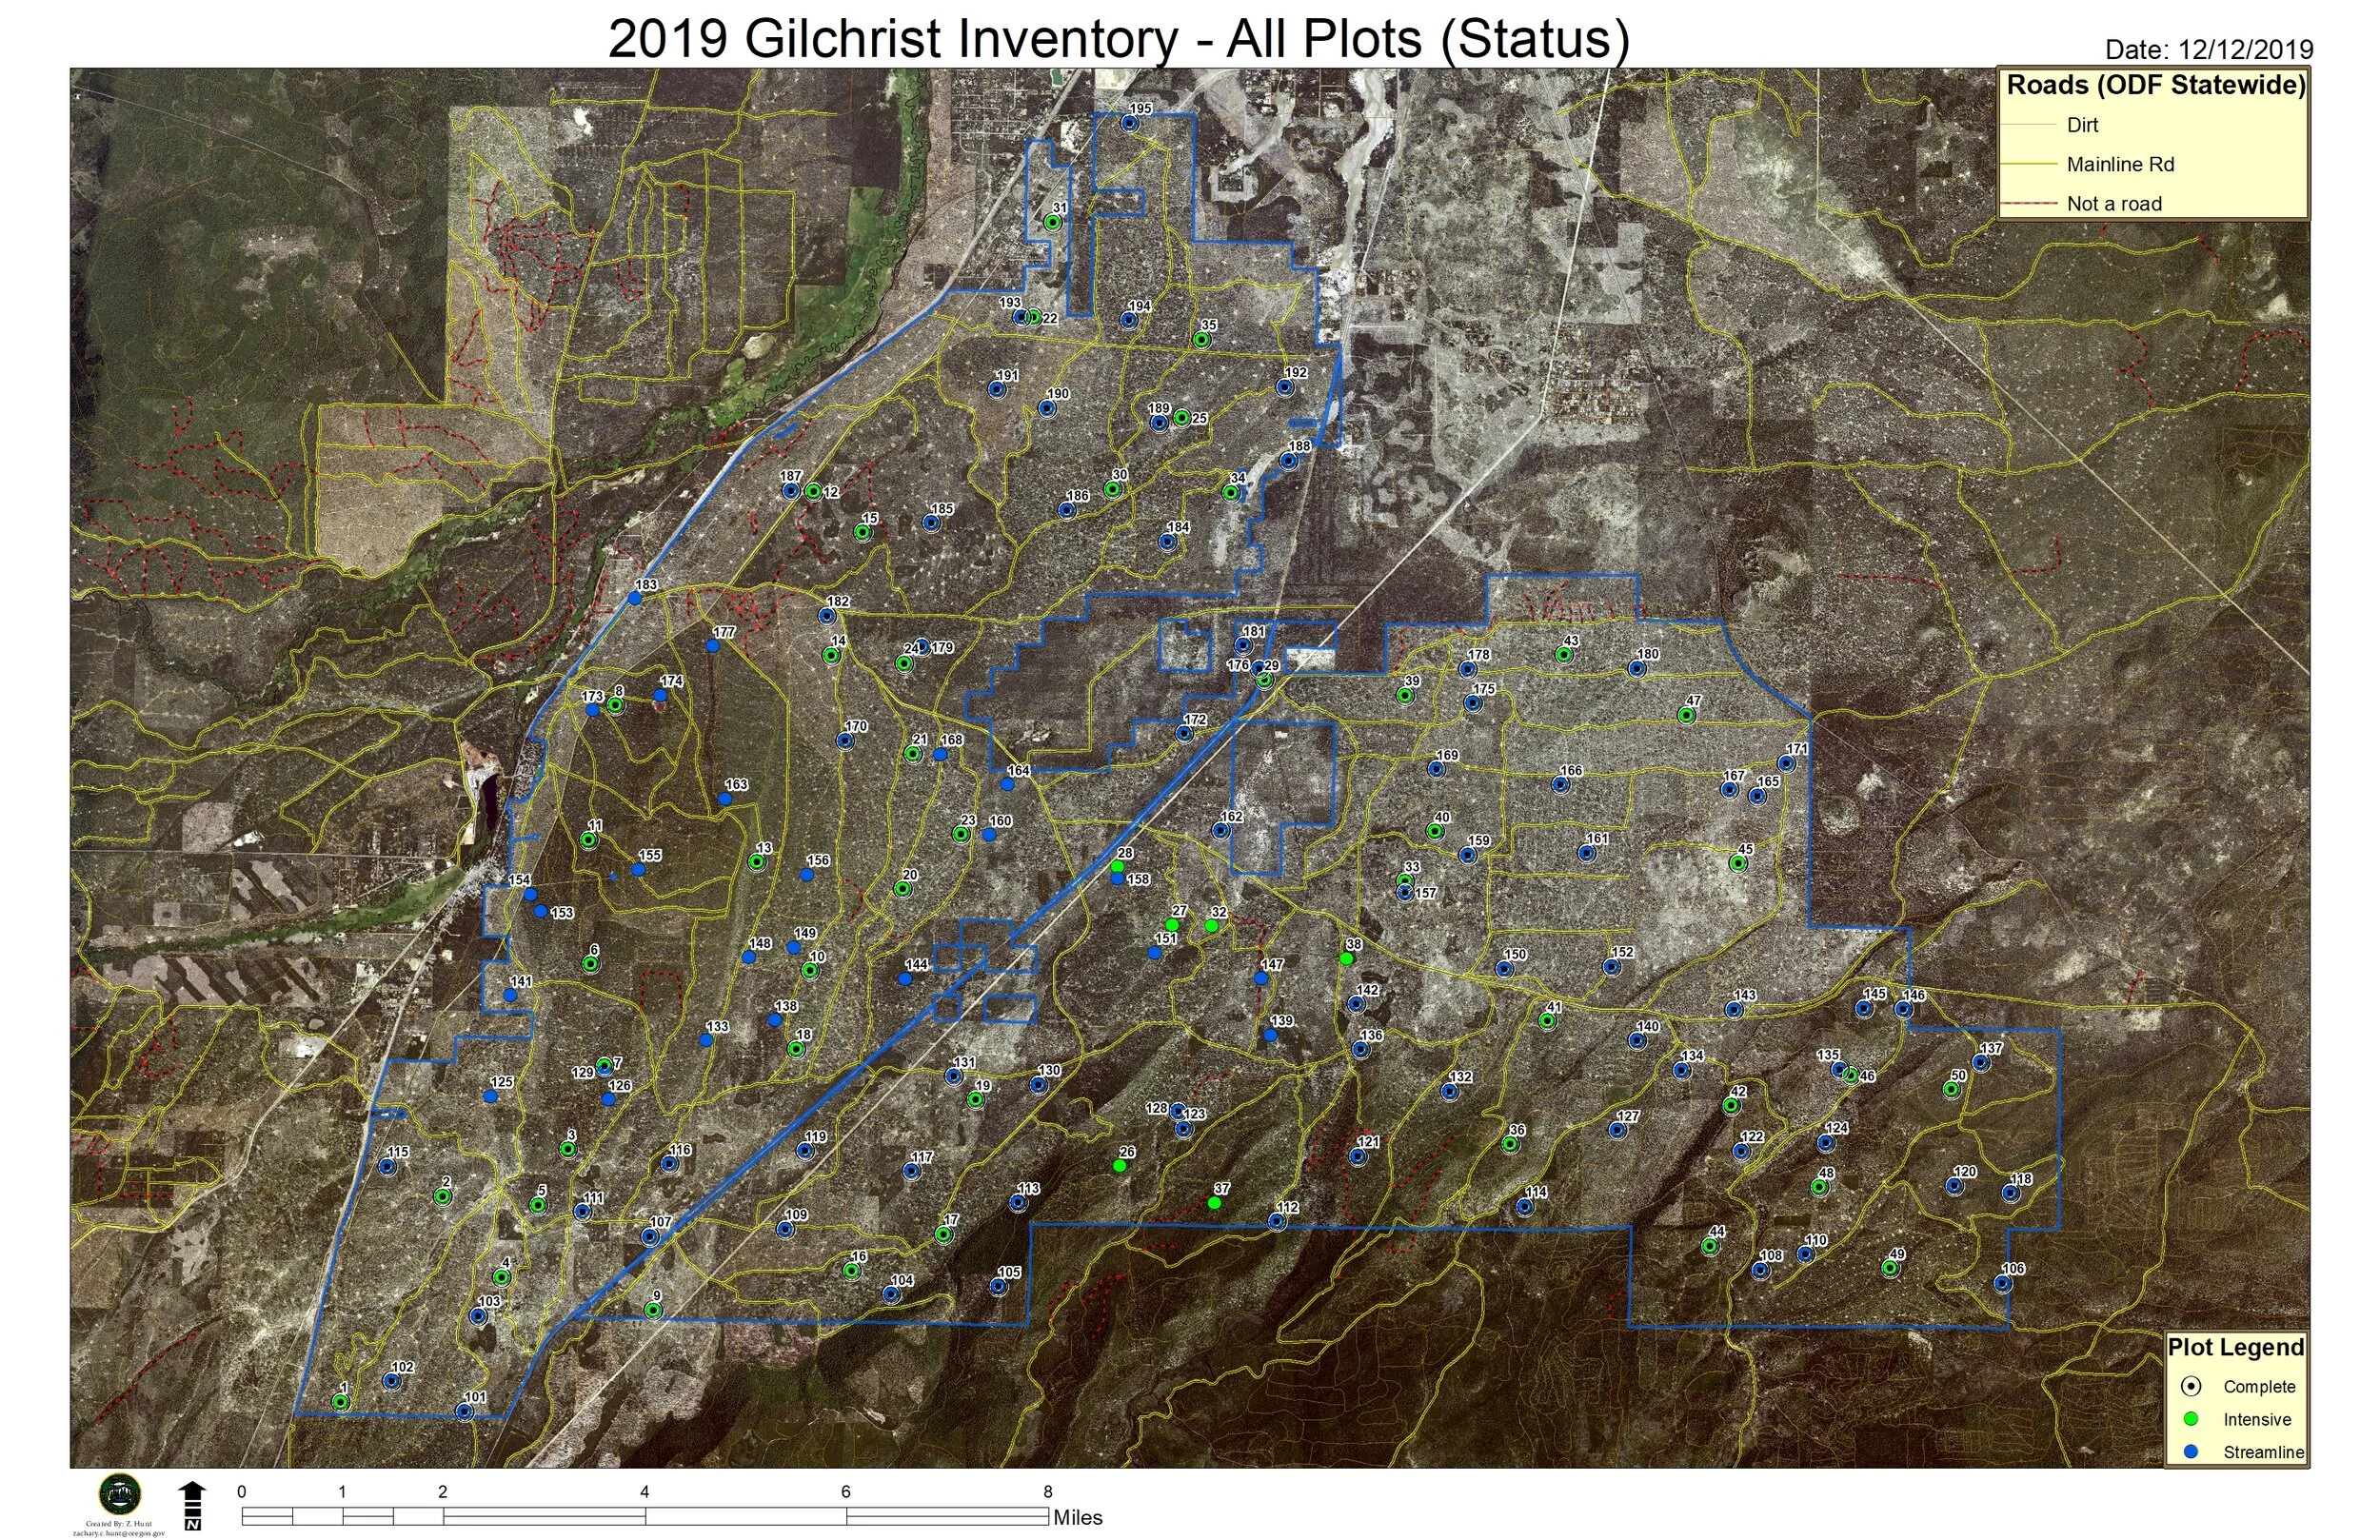
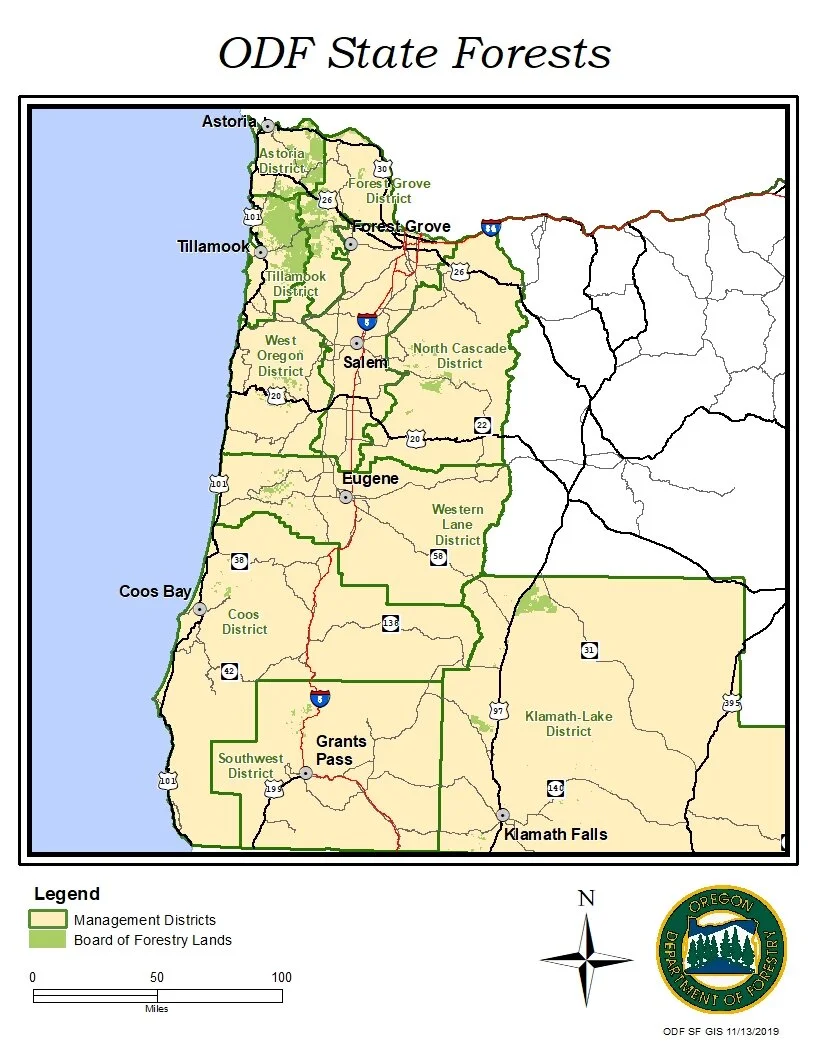
This is one of many maps created for the Inventory and Monitoring Unit at the Oregon Department of Forestry for the purpose of creating a vegetation inventory of the newly acquired Gilchrist State Forest. This particular product is a vicinity map of the entire forest boundary, and an excellent example of my experience creating high quality maps that meet professional cartographic standards.
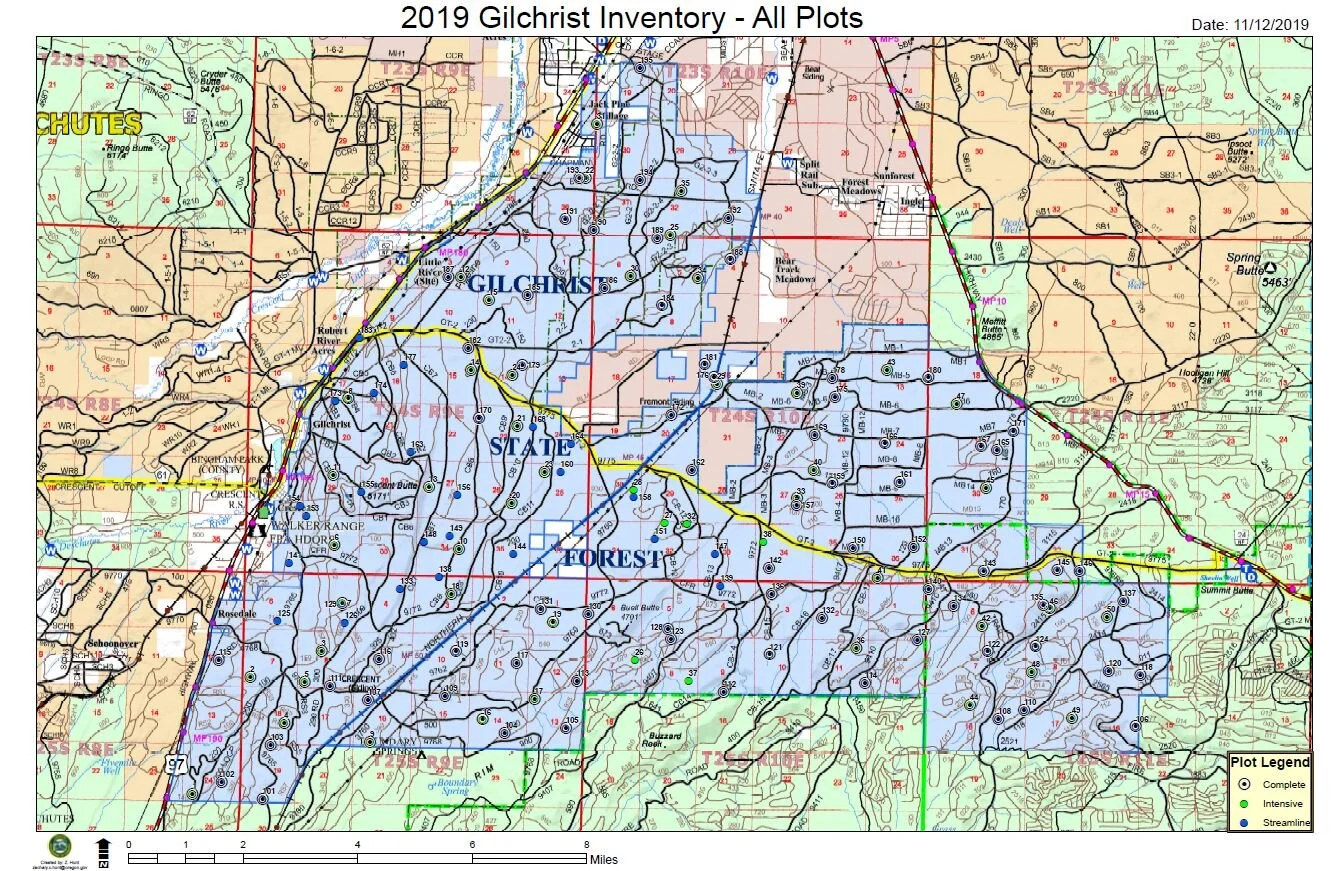
This is one of many maps created for the Inventory and Monitoring Unit at the Oregon Department of Forestry for the purpose of creating a vegetation inventory of the newly acquired Gilchrist State Forest. This particular product is a vicinity map of the entire forest boundary, and an excellent example of my experience creating high quality maps that meet professional cartographic standards.
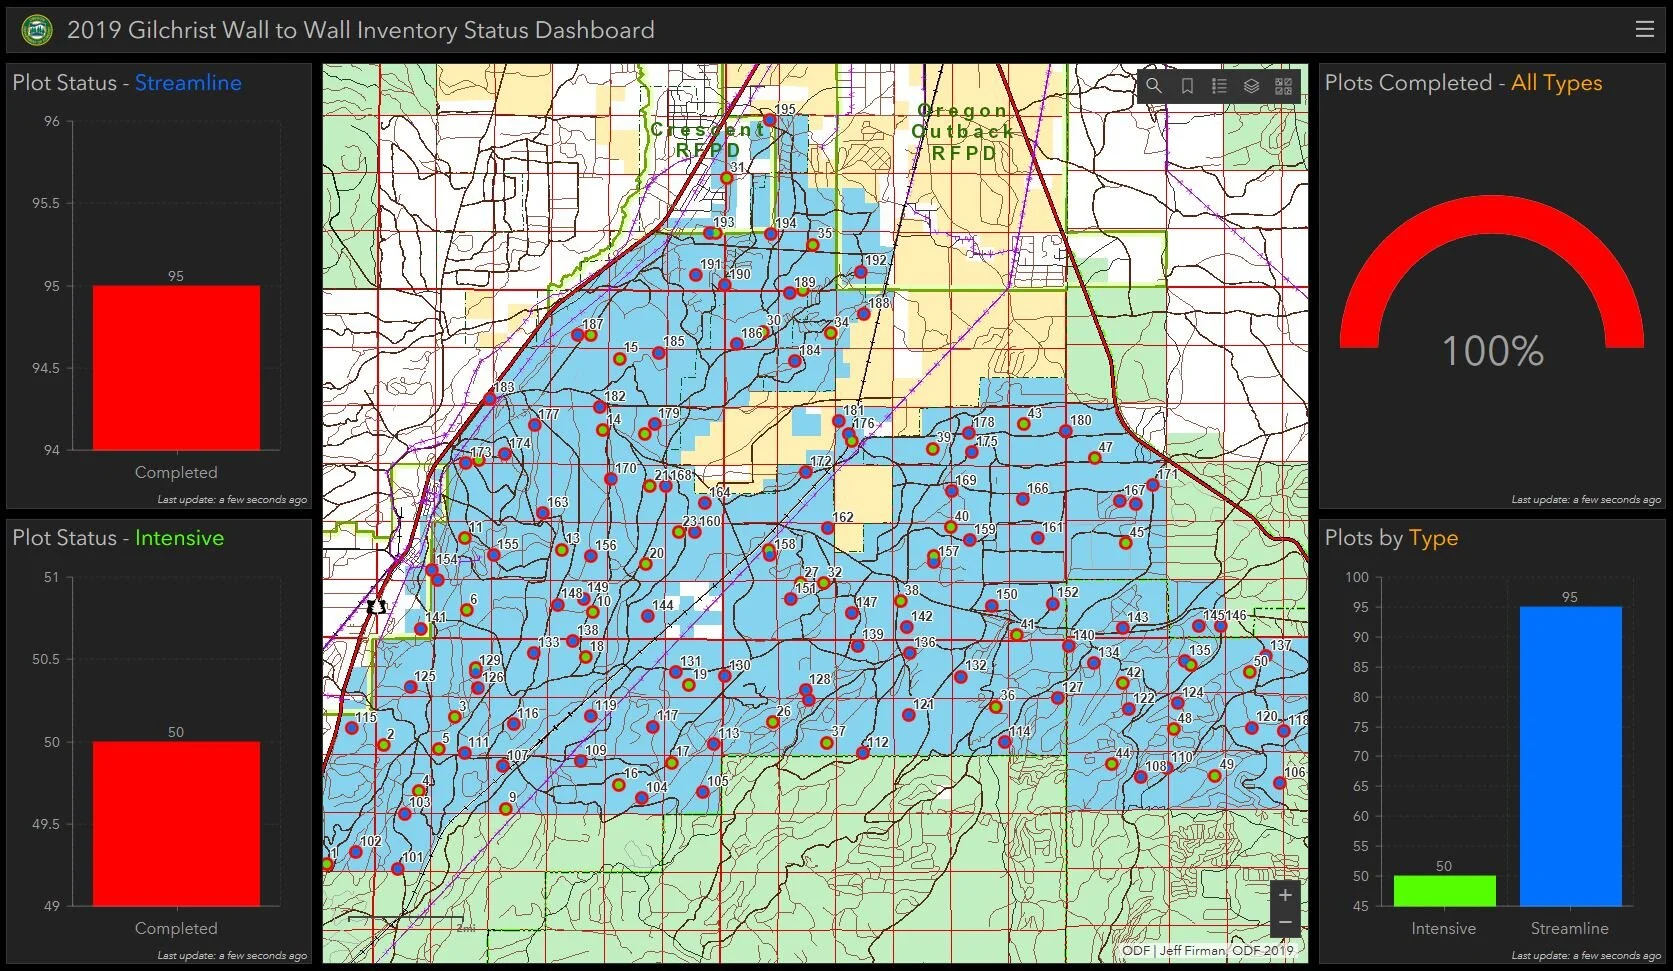
This is a Dashboard that was used with the mobile application Collector to aide Inventory Foresters with collecting complex datasets in the field in an easy and organized fashion. An example of my experience utilizing an ESRI ecosystem to design, build, deploy, analyze and report complex data to a multitude of stakeholders.
This is a Web Map that was used with the mobile application Collector to aide Inventory Foresters with collecting complex datasets in the field in an easy and organized fashion. An example of my experience utilizing an ESRI ecosystem to design, build, deploy, analyze and report complex data to a multitude of stakeholders.